CBRE Group, Inc. reports 31% revenue increase for the third quarter ended September 30, 2014
Revenue Increases 31% and Adjusted Earnings Per Share Rises 33% to $0.40
Los Angeles, CA, 2014-10-30— /EPR Retail News/ — CBRE Group, Inc. (NYSE:CBG) today reported very strong revenue and earnings growth for the third quarter ended September 30, 2014.
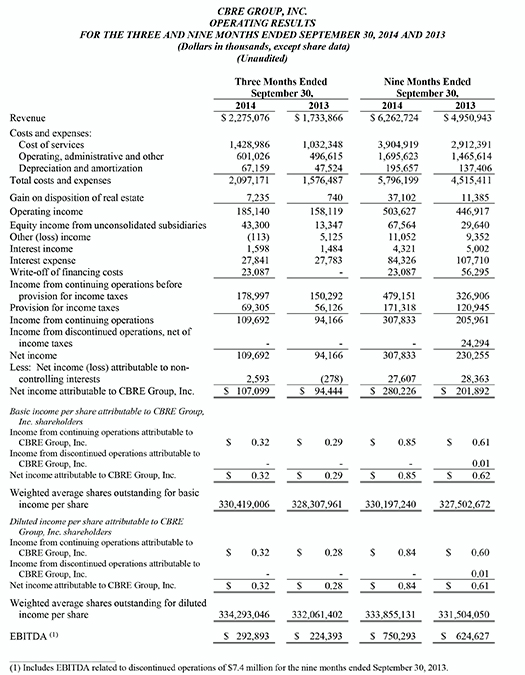
- Revenue for the quarter totaled $2.3 billion, an increase of 31% from $1.7 billion in the third quarter of 2013.
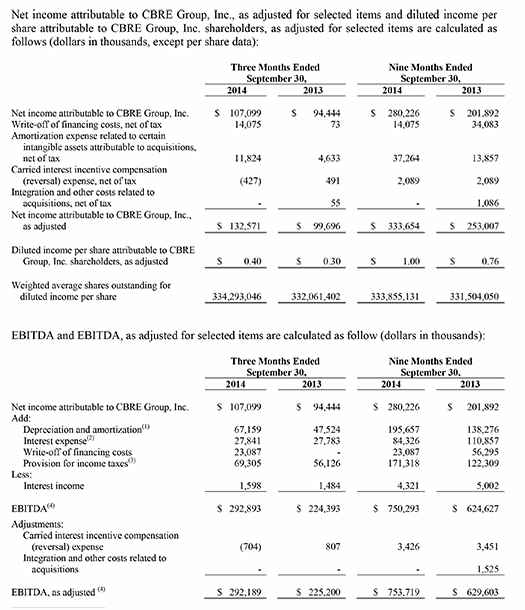
- Excluding selected items1, net income2 rose 33% to $132.6 million from $99.7 million in the third quarter of 2013, and adjusted earnings per diluted share also improved 33% to $0.40 from $0.30 in the prior-year period. For the third quarter, selected items (net of income taxes) totaled $25.5 million – including $14.1 million related to the early re-payment of debt and $11.8 million of non-cash amortization relating to prior acquisitions – versus $5.3 million for the same period in 2013.
- On a U.S. GAAP basis, net income rose 13% to $107.1 million, compared with $94.4 million for the third quarter of 2013. GAAP earnings per diluted share rose 14% to $0.32, compared with $0.28 in last year’s third quarter.
- Excluding selected items, EBITDA3 increased 30% to $292.2 million from $225.2 million in the third quarter of 2013. EBITDA3 (including selected items) rose 31% to $292.9 million for the third quarter of 2014, from $224.4 million for the same period a year earlier.
Management Commentary
“CBRE produced excellent growth across markets and business lines during the third quarter, reflecting the strength of our integrated, global service offering,” said Bob Sulentic, president and chief executive officer of CBRE. “Growth was strong in all three global regions and we achieved double-digit revenue increases in nearly all business lines, led by impressive gains in capital markets, occupier outsourcing and leasing.”
Revenue rose by 20% or more in all three global regions. Europe, the Middle East and Africa (EMEA) achieved 25% (19% in local currency) organic revenue growth – 101% (95% in local currency) including the contributions from Norland Managed Services, Ltd, which CBRE acquired in late December 2013. Asia Pacific posted its strongest growth in 16 quarters with revenue rising 25% (23% in local currency). The Americas, CBRE’s largest business segment, saw revenue improve 20% (same in local currency), fueled by double-digit increases in every major business line.
Globally, property sales revenue surged 33% (32% in local currency) during the quarter, with significant increases across all three global regions. Notably, U.S. property sales improved 31% as CBRE executed several large single-asset and portfolio sales during the quarter, including One Wall Street for Bank of New York Mellon and a $1.8 billion multifamily portfolio for DRA Advisors and Bell Partners Corporation. Strong capital flows into commercial real estate – coupled with the continued availability of debt capital – led to a 41% increase (40% in local currency) in commercial mortgage services revenue.
Large occupiers continue to demonstrate a strong appetite for integrated real estate services. CBRE is well placed to capitalize on this ongoing trend, as reflected in 26 new outsourcing contracts signed during the third quarter. Global occupier outsourcing revenue improved 18% on an organic basis during the quarter. With contributions from the Norland acquisition, global revenue from this business line rose 61%.
Property leasing revenue improved by double digits for the fifth consecutive quarter, rising by 15% (14% in local currency). Growth was paced by an 18% increase (18% in local currency) in the Americas, where CBRE continues to make strong market share gains.
Development Services saw revenue rise 27% and EBITDA increase four-fold reflecting the focus on developing high-quality assets in markets and sectors with significant investor demand.
Global Investment Management revenue declined during the quarter, primarily due to last year’s third quarter including nearly $30 million of carried-interest revenue, which did not recur in this year’s period. Otherwise, revenue in this segment would have increased 7% (5% in local currency). Carried interest is incremental revenue that CBRE earns when it sells assets within portfolios it manages for institutional investors at values that exceed specified return thresholds. The timing of such sales is determined by the macro market environment and fund lifecycles. Capital raising activity in Global Investment Management remained strong with $9.1 billion of new commitments over the past 12 months.
The ongoing shift in the company’s business mix toward contractual revenue continued during the third quarter. Contractual revenue rose to 51% of total revenue – up from 48% in the third quarter of 2013.
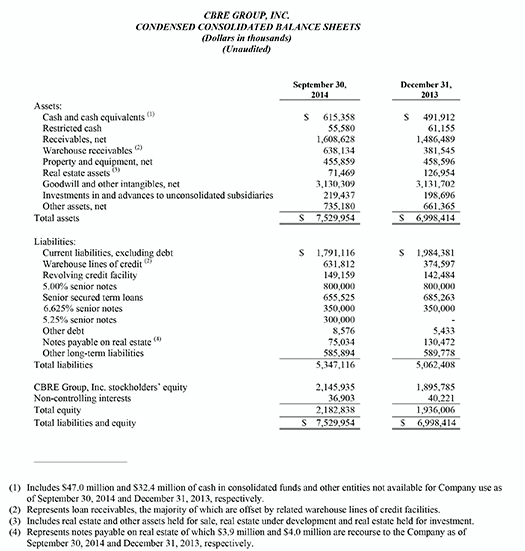
During the third quarter, CBRE issued $300 million of 5.25% senior notes due 2025 and on October 27, 2014, CBRE used the note proceeds, together with cash on hand and borrowing under our revolving credit facility, to redeem in full its 6.625% senior notes due 2020 ($350 million aggregate principal amount). These actions will lower CBRE’s annual interest expense by approximately $5 million and will extend debt maturity on $300 million of its senior unsecured debt by 4-1/2 years at an attractive, fixed interest rate.
Third-Quarter 2014 Segment Results
Americas Region (U.S., Canada and Latin America)
-
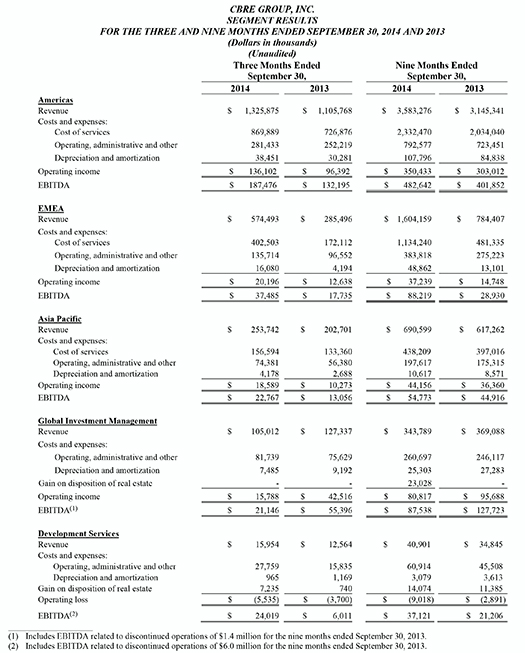
Revenue rose 20% (same in local currency) to $1.3 billion, compared with $1.1 billion for the third quarter of 2013. The improved revenue was driven by higher property sales, leasing, occupier outsourcing and commercial mortgage services activities.
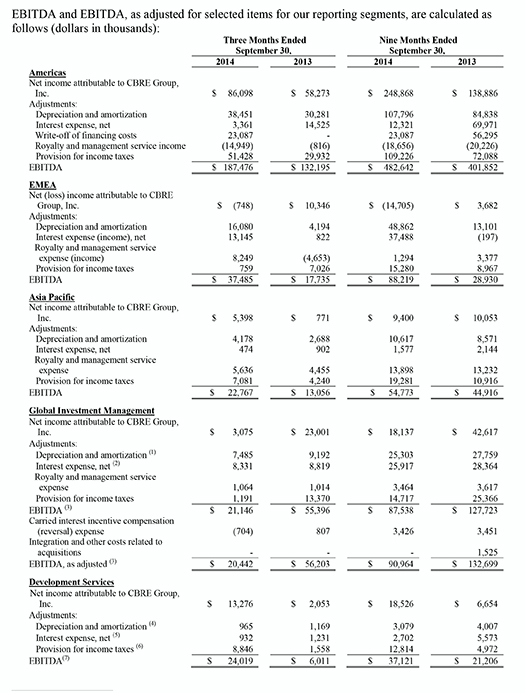
- EBITDA increased 42% to $187.5 million compared with $132.2 million in last year’s third quarter.
- Operating income totaled $136.1 million, an increase of 41% from $96.4 million for the prior-year third quarter.
EMEA Region (primarily Europe)
-
Revenue rose 101% (95% in local currency) to $574.5 million, compared with $285.5 million for the third quarter of 2013. Excluding the contributions from Norland, EMEA revenue increased 25% (19% in local currency) over the prior-year period. The increase was driven by higher property sales and appraisal activities as well as significant organic growth in occupier outsourcing.
- EBITDA increased 111% to $37.5 million compared with $17.7 million in the prior-year third quarter.
- Operating income totaled $20.2 million, an increase of 60% from $12.6 million for the third quarter of 2013.
Asia Pacific Region (Asia, Australia and New Zealand)
- Revenue was $253.7 million, an increase of 25% (23% in local currency) from $202.7 million for the third quarter of 2013. Performance improved in several countries, particularly Japan and Australia.
- EBITDA increased 74% to $22.8 million compared with $13.1 million in the prior-year third quarter.
- Operating income totaled $18.6 million, an increase of 81% compared with $10.3 million in the third quarter of 2013.
Global Investment Management (investment management operations in the U.S., Europe and Asia Pacific)
- Revenue was $105.0 million compared with $127.3 million for the third quarter of 2013.
- Excluding selected items, EBITDA totaled $20.4 million compared with $56.2 million in the prior-year third quarter. EBITDA (including selected items) totaled $21.1 million compared with $55.4 million in the third quarter of 2013.
- Operating income was $15.8 million compared with $42.5 million for the third quarter of 2013.
- Prior-year period results included $29.9 million of carried-interest revenue and $2.3 million of carried-interest expense reversal, while third-quarter 2014 results included $0.7 million of carried-interest revenue. Excluding carried interest, revenue was up 7%, driven by significantly higher acquisition fees.
Development Services (real estate development and investment activities primarily in the U.S.)
- Revenue rose 27% to $16.0 million, compared with $12.6 million for the third quarter of 2013.
- EBITDA increased 300% to $24.0 million compared with $6.0 million in the prior-year period. The increase was largely driven by higher income from property sales (reflected in both gain on disposition of real estate and equity earnings) in the current-year third quarter.
- Operating loss totaled $5.5 million compared with an operating loss of $3.7 million for the third quarter of 2013. Under U.S. GAAP, equity earnings, which include some property sales, are not part of the calculation of operating income/loss.
- Reflecting improving fundamentals, development projects in process totaled $5.1 billion, up $300 million from second-quarter 2014, and the inventory of pipeline deals totaled $2.9 billion, up $1 billion from second-quarter 2014.
Nine-Month 2014 Results
- Revenue for the nine months ended September 30, 2014 totaled $6.3 billion, an increase of 26% from $5.0 billion for the nine months ended September 30, 2013.
- Excluding selected items, net income increased 32% to $333.7 million for the first nine months of 2014 from $253.0 million in the same period in 2013. Adjusted earnings per diluted share also increased 32% to $1.00 compared with $0.76 for the prior-year period. Selected items (net of income taxes) totaled $53.5 million for the first nine months of 2014, and $51.1 million for the same period in 2013.
- On a U.S. GAAP basis, net income rose 39% to $280.2 million for the first nine months of 2014 from $201.9 million for the same period of 2013 and earnings per diluted share increased 38% to $0.84 compared with $0.61 for the prior-year period.
- Excluding selected items, EBITDA increased 20% to $753.7 million in the current nine-month period from $629.6 million in the first nine months of 2013. EBITDA (including selected items) also rose 20% to $750.3 million for the first nine months of 2014, compared with $624.6 million for the same period a year earlier.
Business Outlook
“We enter the final months of 2014 with strong momentum across our business lines,” said Mr. Sulentic. “Underlying fundamentals continue to improve and market sentiment remains positive. We continue to execute our strategy by investing in our people and platform to create value for our clients and to extend our competitive advantage in the marketplace.”
With two months left in 2014, CBRE’s full-year performance is coming into sharper focus. Therefore, the company is raising its adjusted EPS guidance4 for the full year to a range of $1.65 to $1.70. CBRE is taking this action while being mindful of the slowing economic growth outside the U.S. and the challenging earnings comparison the company faces in the fourth quarter. CBRE generated approximately $58 million of EBITDA from carried interest in the fourth quarter of 2013.
Conference Call Details
The company’s third-quarter earnings conference call will be held today (Wednesday, October 29, 2014) at 5:00 p.m. Eastern Time. A webcast will be accessible through the Investor Relations section of the company’s website at www.cbre.com/investorrelations.
The direct dial-in number for the conference call is 877-407-8037 for U.S. callers and 201-689-8037 for international callers. A replay of the call will be available starting at 10 p.m. Eastern Time on October 29, 2014, and ending at midnight Eastern Time on November 6, 2014. The dial-in number for the replay is 877-660-6853 for U.S. callers and 201-612-7415 for international callers. The access code for the replay is 13591778. A transcript of the call will be available on the company’s Investor Relations website at www.cbre.com/investorrelations.
About CBRE Group, Inc.
CBRE Group, Inc. (NYSE:CBG), a Fortune 500 and S&P 500 company headquartered in Los Angeles, is the world’s largest commercial real estate services and investment firm (in terms of 2013 revenue). The Company has approximately 44,000 employees (excluding affiliates), and serves real estate owners, investors and occupiers through approximately 350 offices (excluding affiliates) worldwide. CBRE offers strategic advice and execution for property sales and leasing; corporate services; property, facilities and project management; mortgage banking; appraisal and valuation; development services; investment management; and research and consulting. Please visit our website at www.cbre.com.
Note: This release contains forward-looking statements within the meaning of the ”safe harbor” provisions of the Private Securities Litigation Reform Act of 1995, including statements regarding our future growth momentum, operations, financial performance and business outlook. These forward-looking statements involve known and unknown risks, uncertainties and other factors that may cause the Company’s actual results and performance in future periods to be materially different from any future results or performance suggested in forward-looking statements in this release. Any forward-looking statements speak only as of the date of this release and, except to the extent required by applicable securities laws, the Company expressly disclaims any obligation to update or revise any of them to reflect actual results, any changes in expectations or any change in events. If the Company does update one or more forward-looking statements, no inference should be drawn that it will make additional updates with respect to those or other forward-looking statements. Factors that could cause results to differ materially include, but are not limited to: disruptions in general economic and business conditions, particularly in geographies where our business may be concentrated; volatility and disruption of the securities, capital and credit markets; interest rate increases; the cost and availability of capital for investment in real estate; clients’ willingness to make real estate or long-term contractual commitments and other factors affecting the value of real estate assets, inside and outside the United States; our ability to control costs relative to revenue growth; our ability to retain and incentivize producers; our ability to identify, acquire and integrate synergistic and accretive businesses; costs and potential future capital requirements relating to businesses we may acquire; integration challenges arising out of companies we may acquire; continued high levels of, or increases in, unemployment and general slowdowns in commercial activity; variations in historically customary seasonal patterns that cause our business not to perform as expected; trends in pricing and risk assumption for commercial real estate services; our ability to diversify our revenue model to offset cyclical economic trends in the commercial real estate industry; foreign currency fluctuations; our ability to attract new user and investor clients; our ability to retain major clients and renew related contracts; a reduction by companies in their reliance on outsourcing for their commercial real estate needs, which would affect our revenues and operating performance; client actions to restrain project spending and reduce outsourced staffing levels; changes in tax laws in the United States or in other jurisdictions in which our business may be concentrated that reduce or eliminate deductions or other tax benefits we receive; changes in international law (including anti-corruption, anti-money laundering and trade control law), particularly in Russia, Eastern Europe and the Middle East, due to the rising level of political instability in those regions; our ability to maintain our effective tax rate at or below current levels; our ability to compete globally, or in specific geographic markets or business segments that are material to us; our ability to leverage our global services platform to maximize and sustain long-term cash flow; our ability to maintain EBITDA margins that enable us to continue investing in our platform and client service offerings; our exposure to liabilities in connection with real estate advisory and property management activities and our ability to procure sufficient insurance coverage on acceptable terms; declines in lending activity of Government Sponsored Enterprises, regulatory oversight of such activity and our mortgage servicing revenue from the U.S. commercial real estate mortgage market; our ability to manage fluctuations in net earnings and cash flow, which could result from poor performance in our investment programs, including our participation as a principal in real estate investments; the ability of our Global Investment Management business to maintain and grow assets under management and achieve desired investment returns for our investors, and any potential related litigation, liabilities or reputational harm possible if we fail to do so; our ability to comply with laws and regulations related to our global operations, including real estate licensure, labor and employment laws and regulations, as well as the anti-corruption laws of the U.S. and other countries; our leverage and our ability to perform under our credit facilities; liabilities under guarantees, or for construction defects, that we incur in our Development Services business; the ability of CBRE Capital Markets to periodically amend, or replace, on satisfactory terms, the agreements for its warehouse lines of credit; the effect of significant movements in average cap rates across different property types; and the effect of implementation of new accounting rules and standards.
Additional information concerning factors that may influence the Company’s financial information is discussed under “Risk Factors”, “Management’s Discussion and Analysis of Financial Condition and Results of Operations”, “Quantitative and Qualitative Disclosures About Market Risk” and “Cautionary Note on Forward-Looking Statements” in our Annual Report on Form 10-K for the year ended December 31, 2013 (as amended), and under “Management’s Discussion and Analysis of Financial Condition and Results of Operations”, “Quantitative and Qualitative Disclosures About Market Risk” and “Forward-Looking Statements” in our Quarterly Report on Form 10-Q for the quarter ended June 30, 2014, as well as in the Company’s press releases and other periodic filings with the Securities and Exchange Commission. Such filings are available publicly and may be obtained on the Company’s website at www.cbre.com or upon written request from the CBRE Investor Relations Department at investorrelations@cbre.com.
1 Selected items included the write-off of financing costs, amortization expense related to certain intangible assets attributable to acquisitions, certain carried interest incentive compensation (reversal) expense and integration and other costs related to acquisitions. For the impact of selected charges on specific periods, see the “Non-GAAP Financial Measures” section of this press release.
2 A reconciliation of net income attributable to CBRE Group, Inc. to net income attributable to CBRE Group, Inc., as adjusted for selected items, is provided in the section of this press release entitled “Non-GAAP Financial Measures.”
3 EBITDA represents earnings before net interest expense, write-off of financing costs, income taxes, depreciation and amortization, while amounts shown for EBITDA, as adjusted (or normalized EBITDA), remove the impact of certain cash and non-cash charges related to acquisitions and certain carried interest incentive compensation (reversal) expense. Our management believes that both of these measures are useful in evaluating our operating performance compared to that of other companies in our industry because the calculations of EBITDA and EBITDA, as adjusted, generally eliminate the effects of financing and income taxes and the accounting effects of capital spending and acquisitions, which would include impairment charges of goodwill and intangibles created from acquisitions. Such items may vary for different companies for reasons unrelated to overall operating performance. As a result, our management uses these measures to evaluate operating performance and for other discretionary purposes, including as a significant component when measuring our operating performance under our employee incentive programs. Additionally, we believe EBITDA and EBITDA, as adjusted, are useful to investors to assist them in getting a more complete picture of our results from operations.
However, EBITDA and EBITDA, as adjusted, are not recognized measurements under U.S. generally accepted accounting principles, or GAAP, and when analyzing our operating performance, readers should use EBITDA and EBITDA, as adjusted, in addition to, and not as an alternative for, net income as determined in accordance with GAAP. Because not all companies use identical calculations, our presentation of EBITDA and EBITDA, as adjusted, may not be comparable to similarly titled measures of other companies. Furthermore, EBITDA and EBITDA, as adjusted, are not intended to be measures of free cash flow for our management’s discretionary use, as they do not consider certain cash requirements such as tax and debt service payments. The amounts shown for EBITDA and EBITDA, as adjusted, also differ from the amounts calculated under similarly titled definitions in our debt instruments, which are further adjusted to reflect certain other cash and non-cash charges and are used to determine compliance with financial covenants and our ability to engage in certain activities, such as incurring additional debt and making certain restricted payments.
For a reconciliation of EBITDA and EBITDA, as adjusted, to net income attributable to CBRE Group, Inc., the most comparable financial measure calculated and presented in accordance with GAAP, see the section of this press release titled “Non-GAAP Financial Measures.”
4 We have not reconciled the non-GAAP earnings per share guidance included in this release to the most directly comparable GAAP measure because this cannot be done without unreasonable effort.
Non-GAAP Financial Measures
The following measures are considered “non-GAAP financial measures” under SEC guidelines:
(i) Net income attributable to CBRE Group, Inc., as adjusted for selected items
(ii) Diluted income per share attributable to CBRE Group, Inc., as adjusted for selected items
(iii) EBITDA and EBITDA, as adjusted for selected items
The Company believes that these non-GAAP financial measures provide a more complete understanding of ongoing operations and enhance comparability of current results to prior periods as well as presenting the effects of selected charges in all periods presented. The Company believes that investors may find it useful to see these non-GAAP financial measures to analyze financial performance without the impact of selected charges that may obscure trends in the underlying performance of its business.
(1) Includes depreciation and amortization expense related to discontinued operations of $0.9 million for the nine months ended September 30, 2013.
(2) Includes interest expense related to discontinued operations of $3.2 million for the nine months ended September 30, 2013.
(3) Includes provision for income taxes related to discontinued operations of $1.3 million for the nine months ended September 30, 2013.
(4) Includes EBITDA related to discontinued operations of $7.4 million for the nine months ended September 30, 2013.
(1) Includes depreciation and amortization expense related to discontinued operations of $0.5 million for the nine months ended September 30, 2013.
(2) Includes interest expense related to discontinued operations of $1.0 million for the nine months ended September 30, 2013.
(3) Includes EBITDA related to discontinued operations of $1.4 million for the nine months ended September 30, 2013.
(4) Includes depreciation and amortization expense related to discontinued operations of $0.4 million for the nine months ended September 30, 2013.
(5) Includes interest expense related to discontinued operations of $2.2 million for the nine months ended September 30, 2013.
(6) Includes provision for income taxes related to discontinued operations of $1.3 million for the nine months ended September 30, 2013.
(7) Includes EBITDA related to discontinued operations of $6.0 million for the nine months ended September 30, 2013.