WAYNE, NJ, 2014-3-28 — /EPR Retail News/ — Toys“R”Us, Inc. today reported financial results for the fourth quarter and full year of fiscal 2013 ended February 1, 2014. For the fourth quarter, the company reported net sales of $5.3 billion and Adjusted EBITDA1 of $505 million.
Antonio Urcelay, Chairman of the Board of Directors and Chief Executive Officer, Toys“R”Us, Inc., stated, “It was a challenging year, with declines in both our Domestic and International segments. The U.S. business experienced the more significant downturn, primarily due to a decrease in net sales, margin pressure and one-time items, including the write-down of excess and obsolete inventory as we take the necessary and prudent steps to improve the business.”
Mr. Urcelay continued, “Over the past several months, the team has been focused on developing our strategic plan, which we strongly believe will address foundational issues needed to stabilize the business over the short-term, while allowing us to implement new initiatives to put the company on track for profitable growth in the future. At the same time, we accelerated our expansion in China, where business has continued to be strong.”
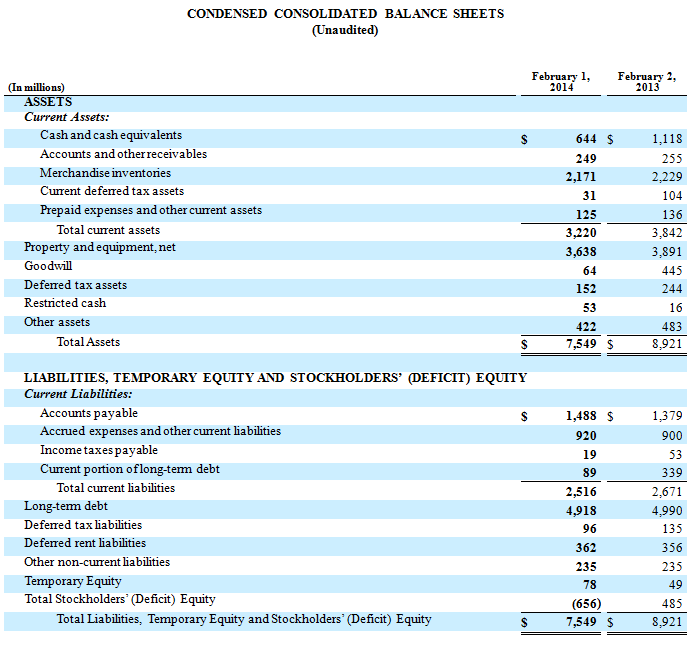
“The company ended the year with a strong liquidity position of approximately $1.8 billion and reduced our total long term debt by $322 million to $5.0 billion. In addition, we are pleased that last week we successfully refinanced our $1.85 billion senior secured revolving credit facility, a key component of our capital structure. The execution of this transaction ensures our ability to appropriately fund the working capital needs of our operations at rates that are significantly lower than the prior revolving credit facility.”
“We are also pleased that the 2014 fiscal year has started off well, with a 3.5% comparable store net sales increase in the U.S. and a 0.2% comparable store net sales increase in our International segment through the first seven fiscal weeks. The U.S. comparable store net sales results are largely attributable to the learning, juvenile and entertainment categories which were impacted by strong sales of hot movie-related products, both in-store and online, and an enhanced e-commerce shipping offer.”
Fourth Quarter Fiscal 2013 Highlights
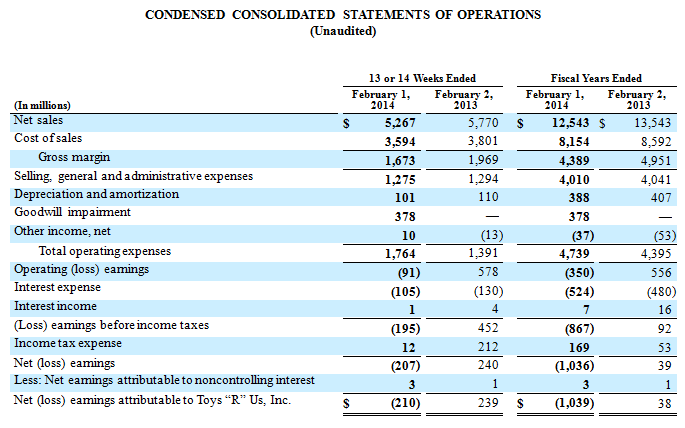
- Comparable store net sales were down 4.1% in the Domestic segment and 2.2% in the International segment. The overall decrease in comparable store net sales resulted primarily from decreases in the entertainment (which includes electronics, video game hardware and software), learning and juvenile (including baby) categories.
- Net sales were $5.3 billion, a decrease of $503 million or 8.7% compared to the prior year. Our reporting period for the fourth quarter of fiscal 2013 included 13 weeks compared to 14 weeks in the prior year, with the extra week in the prior year accounting for net sales of $152 million. Excluding the impact of the extra week in the prior year and foreign currency translation, which decreased net sales by $117 million, net sales declined $234 million or 4.1%.
- Gross margin, as a percentage of net sales, was 31.8% versus 34.1% in the prior year, a decrease of 2.3 percentage points primarily due to margin rate declines across all Domestic categories. The declines are due in part to our competitive pricing strategy and inventory clearance efforts, as well as an inventory write-down of $51 million recorded within the Domestic segment.
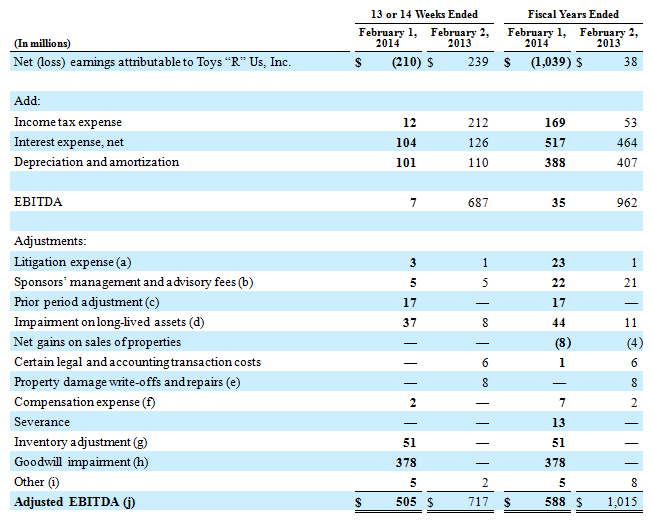
- Adjusted EBITDA1 was $505 million, compared to $717 million in the prior year, a decline of $212 million.
- Net loss was $210 million, compared to net earnings of $239 million in the prior year, a decrease of $449 million. The decline was mainly attributable to $378 million of goodwill impairment and a $296 million decrease in gross margin dollars, which included an inventory write-down of $51 million recorded within the Domestic segment. Partially offsetting the decrease was a $200 million decline in income tax expense predominantly due to the decrease in earnings before income taxes.
Full Year Fiscal 2013 Highlights
The following highlights combine the fourth quarter results being announced today with the results of the first three quarters of the fiscal year, which were previously disclosed:
- Comparable store net sales were down 5.0% in the Domestic segment and 3.3% in the International segment. The overall decrease in comparable store net sales resulted primarily from decreases in the juvenile (including baby), entertainment (which includes electronics, video game hardware and software) and learning categories.
- Net sales were $12.5 billion, a decrease of $1.0 billion or 7.4% compared to the prior year. Our reporting period for fiscal 2013 included 52 weeks compared to 53 weeks in fiscal 2012, with the extra week in the prior year accounting for net sales of $152 million. Excluding the impact of the extra week in the prior year and foreign currency translation, which decreased net sales by $329 million, net sales declined $519 million or 3.8% primarily as a result of a decrease in comparable store net sales, partially offset by an increase in net sales from new stores in the International segment.
- Gross margin, as a percentage of net sales, was 35.0% versus 36.6% in the prior year, a decrease of 1.6 percentage points primarily due to margin rate declines across all Domestic categories. The declines are due in part to our competitive pricing strategy and inventory clearance efforts, as well as an inventory write-down of $51 million recorded within the Domestic segment. Partially offsetting these decreases was an increase in vendor allowances recorded within the International segment and improvements in sales mix away from lower margin products within the Domestic and International segments, predominantly in our entertainment category. Gross margin dollars were $4,389 million, compared to $4,951 million in the prior year, a decrease of $562 million. Foreign currency translation decreased gross margin dollars by $110 million.
- Selling, general and administrative expenses (“SG&A”) decreased by $31 million to $4,010 million, compared to $4,041 million in the prior year. Foreign currency translation decreased SG&A by $98 million. Excluding the impact of foreign currency translation, SG&A increased primarily as a result of a $24 million increase in occupancy costs predominantly as a result of new stores and store improvements, a $20 million increase in litigation expense related to an adverse liability judgment, and a $17 million increase in accrued vacation expense resulting from a prior period correction.
- Adjusted EBITDA1 for fiscal 2013 was $588 million, compared to $1,015 million in the prior year, a decline of $427 million.
- Interest expense was $524 million, an increase of $44 million from the prior year’s level of $480 million. The increase in interest expense was primarily due to $77 million of incremental expense associated with the current year repayment of the $950 million 10.750% senior unsecured notes due fiscal 2017, which included a redemption premium of $51 million. Partially offsetting the increase was $19 million in savings associated with refinancing the unsecured notes to a $985 million senior unsecured term loan facility due fiscal 2019 at a lower rate of interest, as well as the prior year repayment of the $400 million 7.875% senior notes due fiscal 2013, which included a make-whole premium of $18 million.
- Net loss was $1.0 billion, compared to net earnings of $38 million in the prior year. The decline was mainly attributable to two significant non-cash charges, goodwill impairment of $378 million and an increase of $349 million in non-cash charges associated with the valuation allowance on deferred tax assets as the company has determined it is more likely than not that these assets will not be realized in the foreseeable future. Excluding these items, the company would have a net loss of $312 million for fiscal 2013 primarily due to a decrease in gross margin dollars of $562 million, which included an inventory write-down of $51 million recorded within the Domestic segment.
Capital Spending and Depreciation
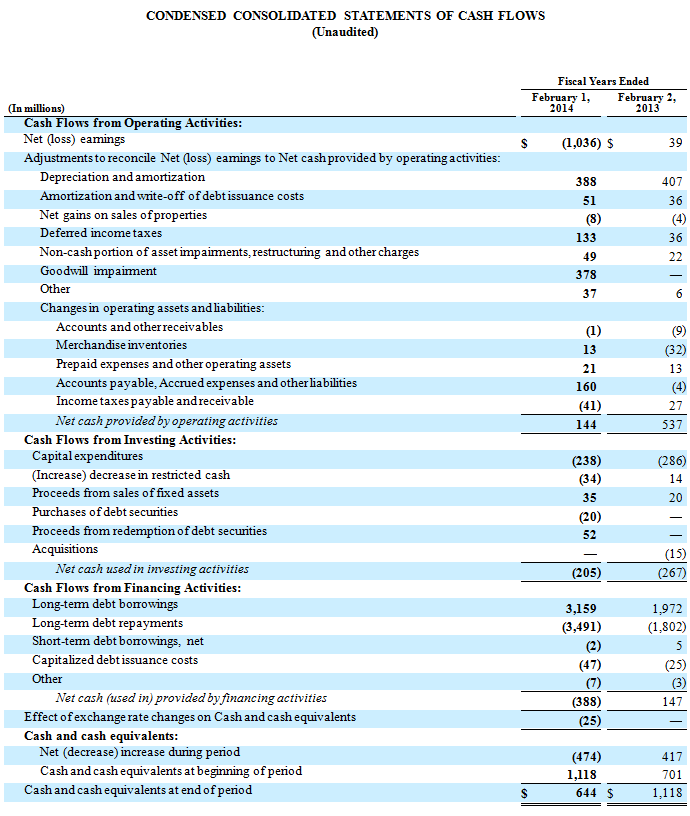
- For the full year, capital spending was $238 million, compared to $286 million in the prior year, a decrease of $48 million.
- Depreciation expense was $388 million, a decrease of $19 million from the prior year level of $407 million.
Liquidity and Debt
The company ended the year with cash and cash equivalents of $644 million and unused availability under committed lines of credit of $1.2 billion, which aggregated to approximately $1.8 billion of total liquidity.
Net cash provided by operating activities for fiscal 2013 was $144 million, a decrease of $393 million compared to the prior year amount of $537 million, primarily driven by the current year net loss.
Total long term debt, including the current portion, was $5.0 billion, a decrease of $322 million from the prior year balance of $5.3 billion, primarily due to the partial repayments of the United Kingdom and French credit facilities in conjunction with their respective refinancings, as well as current year loan amortization payments and prepayments associated with the company’s outstanding debt.
Recent Developments
On March 21, 2014, Toys“R”Us – Delaware, Inc. (“Toys“R”Us – Delaware”), a direct wholly−owned subsidiary, and certain of its subsidiaries amended and restated the credit agreement for its senior secured revolving credit facility (“ABL Facility”) in order to extend the maturity date of the facility and amend certain other provisions. The ABL Facility as amended will continue to provide for $1.85 billion of revolving commitments, subject to certain conditions. The ABL Facility has a final maturity date of March 21, 2019, with a springing maturity if the Toys“R”Us – Delaware term loans due fiscal 2016 and fiscal 2018, and the Toys“R”Us – Delaware secured notes due fiscal 2016 are not repaid 30 days prior to maturity. The ABL Facility as amended bears a tiered floating interest rate of London Interbank Offered Rate plus a margin of between 1.50% and 1.75% depending on usage.
1 A detailed description and reconciliation of EBITDA and Adjusted EBITDA, and management’s reasons for using these measures, are set forth at the end of this press release.
About Toys“R”Us, Inc.
Toys“R”Us, Inc. is the world’s leading dedicated toy and juvenile products retailer, offering a differentiated shopping experience through its family of brands. Merchandise is sold in 872 Toys“R”Us and Babies“R”Us stores in the United States and Puerto Rico, and in more than 700 international stores and over 180 licensed stores in 35 foreign countries and jurisdictions. In addition, it exclusively operates the legendary FAO Schwarz brand and sells extraordinary toys in the brand’s flagship store on Fifth Avenue in New York City. With its strong portfolio of e-commerce sites including Toysrus.com, Babiesrus.com, eToys.com and FAO.com, it provides shoppers with a broad online selection of distinctive toy and baby products. Headquartered in Wayne, NJ, Toys“R”Us, Inc. employs approximately 67,000 associates annually worldwide. The company is committed to serving its communities as a caring and reputable neighbor through programs dedicated to keeping kids safe and helping them in times of need. Additional information about Toys“R”Us, Inc. can be found on Toysrusinc.com.
Forward-Looking Statements
All statements that are not historical facts in this press release, including statements about our beliefs or expectations, are forward-looking statements. These statements are subject to risks, uncertainties and other factors, including, among others, the seasonality of our business, competition in the retail industry, changes in our product distribution mix and distribution channels, general economic factors in the United States and other countries in which we conduct our business, consumer spending patterns, our ability to implement our strategy including implementing initiatives for season, the availability of adequate financing, access to trade credit, changes in consumer preferences, changes in employment legislation, our dependence on key vendors for our merchandise, political and other developments associated with our international operations, costs of goods that we sell, labor costs, transportation costs, domestic and international events affecting the delivery of toys and other products to our stores, product safety issues including product recalls, the existence of adverse litigation, changes in laws that impact our business, our substantial level of indebtedness and related debt-service obligations, restrictions imposed by covenants in our debt agreements and other risks, uncertainties and factors set forth in our reports and documents filed with the Securities and Exchange Commission (which reports and documents should be read in conjunction with this press release). In addition, we typically earn a disproportionate part of our annual operating earnings in the fourth quarter as a result of seasonal buying patterns and these buying patterns are difficult to forecast with certainty. We believe that all forward-looking statements are based on reasonable assumptions when made; however, we caution that it is impossible to predict actual results or outcomes or the effects of risks, uncertainties or other factors on anticipated results or outcomes and that, accordingly, one should not place undue reliance on these statements. Forward-looking statements speak only as of the date when made, and we undertake no obligation to update these statements in light of subsequent events or developments unless required by the Securities and Exchange Commission’s rules and regulations. Actual results and outcomes may differ materially from anticipated results or outcomes discussed in forward-looking statements.
The preliminary sales figures disclosed for fiscal 2014 speak only for the periods indicated above and sales for other periods, including for the first quarter of fiscal 2014, may differ materially from the results discussed above.
# # #
For more information please contact:
Lenders and Note Investors:
John D’Ambrosio, Manager, Corporate Treasury at 973-617-5913 or John.D’Ambrosio@toysrus.com
Media:
Kathleen Waugh, Vice President, Corporate Communications at 973-617-5888, 646-366-8823 or waughk@toysrus.com
Non-GAAP Disclosure of EBITDA and Adjusted EBITDA
We believe Adjusted EBITDA is useful to investors because it is frequently used by securities analysts, investors and other interested parties in the evaluation of companies in our industry. Investors of the Company regularly request Adjusted EBITDA as a supplemental analytical measure to, and in conjunction with, the Company’s GAAP financial data. We understand that investors use Adjusted EBITDA, among other things, to assess our period-to-period operating performance and to gain insight into the manner in which management analyzes operating performance.
In addition, we believe that Adjusted EBITDA is useful in evaluating our operating performance compared to that of other companies in our industry because the calculation of EBITDA and Adjusted EBITDA generally eliminates the effects of financing and income taxes and the accounting effects of capital spending and acquisitions, which items may vary for different companies for reasons unrelated to overall operating performance. We use the non-GAAP financial measures for planning and forecasting and measuring results against the forecast and in certain cases we use similar measures for bonus targets for certain of our employees. Using several measures to evaluate the business allows us and investors to assess our relative performance against our competitors.
Although we believe that Adjusted EBITDA can make an evaluation of our operating performance more consistent because it removes items that do not reflect our core operations, other companies, even in the same industry, may define Adjusted EBITDA differently than we do. As a result, it may be difficult to use Adjusted EBITDA or similarly named non-GAAP measures that other companies may use to compare the performance of those companies to our performance. The Company does not, and investors should not, place undue reliance on EBITDA or Adjusted EBITDA as measures of operating performance.
A reconciliation of Net (loss) earnings attributable to Toys “R” Us, Inc. to EBITDA and Adjusted EBITDA is as follows:
(a) Represents litigation expenses recorded for certain legal matters.
(b) Represents the fees expensed to Bain Capital Partners LLC, Kohlberg Kravis Roberts & Co. L.P., and Vornado Realty Trust (collectively, the “Sponsors”) in accordance with the advisory agreement.
(c) Represents a non-cash cumulative correction of prior period accrued vacation accounting in fiscal 2013.
(d) Asset impairments primarily due to the identification of underperforming stores and the relocation of certain stores.
(e) Represents the write-off of damaged assets and repairs from a hurricane that hit the east coast of the United States and other property losses, net of insurance claims.
(f) Represents the incremental compensation expense related to one-time executive awards, the fair market value remeasurement of existing liability awards and the repurchase of awards by the Company upon termination.
(g) Represents the incremental expense related to the write-down of excess and obsolete inventory.
(h) Represents the impairment of goodwill associated with our Toys-Domestic and Toys-Japan reporting units.
(i) Represents miscellaneous other charges consisting primarily of store closure costs and restructuring which were not individually significant for separate disclosure.
(j) Adjusted EBITDA is defined as EBITDA (earnings before net interest income (expense), income tax expense (benefit), depreciation and amortization), as further adjusted to exclude the effects of certain income and expense items that management believes make it more difficult to assess the Company’s actual operating performance including certain items which are generally non-recurring. We have historically excluded the impact of such items from internal performance assessments. We believe that excluding items such as Sponsors’ management and advisory fees, goodwill and asset impairment charges, restructuring charges, impact of litigation, noncontrolling interest, net gains on sales of properties and other charges, helps investors compare our operating performance with our results in prior periods. We believe it is appropriate to exclude these items as they are not related to ongoing operating performance and, therefore, limit comparability between periods and between us and similar companies.


