International Market Place offers most sought-after retailers and world-class restaurants with the opening of its open-air shopping center in Waikīkī

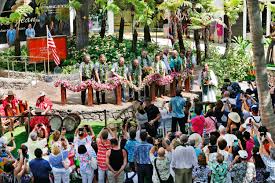
HONOLULU, 2016-Aug-27 — /EPR Retail News/ — Thousands gathered today (08/25/2016) to take part in the grand opening of the fully reimagined International Market Place in Waikīkī. The 345,000-square-foot, open-air shopping center offers Hawai‘i’s first Saks Fifth Avenue as well as a world-class lineup of restaurants and retailers – nearly 50 percent of which will be unique to O’ahu.

“From dining under the sun and stars on the spectacular Grand Lānai to the excellent retail and entertainment, International Market Place will once again serve as a special gathering place for residents and tourists in the heart of Waikīkī,” said Robert S. Taubman, chairman, president and CEO of Taubman Centers, Inc. “We believe it will become a premiere destination on the island, and one of the best assets in our portfolio.”

Situated between the bustling Kalākaua and Kūhiō Avenues, International Market Place will offer approximately 90 of today’s most sought-after retailers and ten world-class restaurants. The center’s exceptional design incorporates a “cultural journey” of the land and its people, water features, indigenous landscaping and the historic 160-year-old banyan tree.

“International Market Place offers a unique Hawaiian sense of place that honors the past, perpetuates Queen Emma’s legacy and looks to the future,” said Cordell Lietz, president, CoastWood Capital Group. “It has been an honor to work with Taubman and Queen Emma Land Company to bring to fruition our shared vision for the important historic site.”

“We are excited for this property’s future as it establishes its own reputation and legacy as a new iconic landmark and gathering place,” said Eric Martinson, president of Queen Emma Land Company, the owners of the land on which International Market Place sits.

The International Market Place retail and restaurant lineup includes the following. A single asterisk (*) before the name indicates brands that are unique to the island.

STORES:
*45rpm
ABC Stores
*Abeo
Abercrombie & Fitch
Aesop
Anthropologie
Banana Republic
*BCBG MAX AZRIA
Brunello Cucinelli
*Capital Teas
*Catimini
Chapel Hats
*Christian Louboutin
Clarks
Crazy Shirts
*Fabletics
Flip Flop Shops
FootAction USA
Fossil
*Free People
GameStop
GNC Live Well
Godiva Belgium 1926
Greenroom Hawaii
*Hanna Andersson
*Hervé Léger
Hilton Grand Vacations (kiosk)
Hollister
Honolulu Cookie Co.
*Intermix
Island Art & Sole
*Jo Malone
*Kona Coffee Purveyors
*Kula & Ko
Laline
Lani Beach by Mireille
L’Occitane en Provence
LUSH Fresh Handmade Cosmetics
MAC
Magnolia Ice Cream & Treats
Maui Divers Jewelry
Michael Kors
*Mitsuwa Marketplace
*Oliver Peoples
*Ondademar
Pacific Harley-Davidson
Pandora
Papyrus
*Penhaligon’s
*Robin’s Jean
*Saks Fifth Avenue
Sand People
*Seafolly Australia
*Shinola
Shoe Palace
*Stuart Weitzman
*Sugarfina
Sunglass Hut
Swarovski
Tabora Gallery
Tesla
*Trina Turk
Vera Bradley
Vilebrequin
*YOGASMOGA

RESTAURANTS ON THE GRAND LĀNAI (THIRD LEVEL):
*Baku
*Eating House 1849 by Roy Yamaguchi
*Flour & Barley – Brick Oven Pizza
Goma Tei Ramen
*Herringbone
*Kona Grill
*STRIPSTEAK
*Yauatcha

RESTAURANT ON THE FIRST LEVEL:
*The STREET, A Michael Mina Social House

In addition to the stellar shopping and dining, guests can enjoy a free show each evening called “O Nā Lani Sunset Stories” that kicks off with a ceremonial lighting of the Lamakū Torch Tower that sits proudly on Kalākaua Ave. Honoring the beloved Queen Emma, the nightly show highlights stories, traditions and culture of this special gathering place.

Guests to International Market Place may take advantage of many amenities, including a 700-space parking garage, valet parking, electric vehicle charging stations, free Wi-Fi and much more.

International Market Place was developed through a partnership between Taubman and CoastWood Capital Group in conjunction with Queen Emma Land Company. Revenues will directly support The Queen’s Medical Center, the state’s largest private, nonprofit hospital and its mission of providing quality health care to all of Hawai‘i’s people.

For more information on the shopping, dining and entertainment destination, please visit ShopInternationalMarketPlace.com, Instagram: @intlmktplace and in Japanese @intlmktplacejp; Facebook: facebook.com/IntlMktPlace and in Japanese at facebook.com/IntlMktPlaceJP.

About International Market Place

Located in the heart of Waikīkī, International Market Place is a world-class shopping, dining and entertainment destination featuring a curated mix of upscale and lifestyle brands, and the first Saks Fifth Avenue in Hawai‘i. The shopping center is open from 10 a.m. to 11 p.m. daily. Operating hours for restaurants will vary. For ease of access, the center provides 700 parking spaces and convenient valet parking. For more information, visit ShopInternationalMarketPlace.com and in Japanese ja.shopinternationalmarketplace.com.

About CoastWood Capital Group, LLC

CoastWood Capital Group, LLC is a specialized real estate investment firm based in San Francisco. Founded byCordell Lietz in 2003, the company acquires, manages and develops real estate in the United States with an emphasis on retail and other property types with unique operational characteristics. CoastWood has been actively investing in Hawai‘i for over a decade and holds interests in several properties throughout Hawai‘i, including Waikīkī Trade Center, Kings’ Shops and Queens’ Marketplace.

About Queen Emma Land Company

Queen Emma Land Company (QEL) is a local nonprofit organization established to support and advance health care in Hawai‘i, primarily through The Queen’s Medical Center and its affiliates. QEL accomplishes this by managing and enhancing the income-generating potential of the lands left to The Queen’s Hospital by Queen Emma in 1885, and additional properties owned by The Queen’s Health Systems.

About Taubman

Taubman Centers is an S&P MidCap 400 Real Estate Investment Trust engaged in the ownership, management and/or leasing of 25 regional, super-regional and outlet shopping centers in the U.S. and Asia. Taubman’s U.S.-owned properties are the most productive in the publicly held U.S. regional mall industry. Taubman is currently developing two properties in Asia totaling 2.7 million square feet. Founded in 1950, Taubman is headquartered in Bloomfield Hills, Mich. Taubman Asia, founded in 2005, is headquartered in Hong Kong. www.taubman.com.

For ease of use, references in this press release to “Taubman Centers,” “company,” “Taubman” or an operating platform mean Taubman Centers, Inc. and/or one or more of a number of separate, affiliated entities. Business is actually conducted by an affiliated entity rather than Taubman Centers, Inc. itself or the named operating platform.

This press release may contain forward-looking statements within the meaning of Section 27A of the Securities Act of 1933, as amended, and Section 21E of the Securities Exchange Act of 1934, as amended. These statements reflect management’s current views with respect to future events and financial performance. The forward-looking statements included in this release are made as of the date hereof. Except as required by law, we assume no obligation to update these forward-looking statements, even if new information becomes available in the future. Actual results may differ materially from those expected because of various risks and uncertainties.You should review the company’s filings with the Securities and Exchange Commission, including “Risk Factors” in its most recent Annual Report on Form 10-K and subsequent quarterly reports, for a discussion of such risks and uncertainties.

Contact:

Andrea Lum
Bennet Group
808-286-9569
andrea@bennetgroup.com

Maria Mainville
Director, Strategic Communications, Taubman
248-258-7469
mmainville@taubman.com

###

International Market Place offers most sought-after retailers and world-class restaurants with the opening of its open-air shopping center in Waikīkī


Source: Taubman Centers, Inc.


Dollar Tree, Inc. announces results for its second fiscal quarter ended July 30, 2016

CHESAPEAKE, Va., 2016-Aug-27 — /EPR Retail News/ — Dollar Tree, Inc. (NASDAQ: DLTR), North America’s leading operator of discount variety stores, today (August 25, 2016) reported results for its second fiscal quarter ended July 30, 2016.

Second Quarter Results

Second quarter fiscal 2016 results include nine additional weeks of operations for the Family Dollar segment when compared to the second quarter of fiscal 2015, which included four weeks of operations following the acquisition on July 6, 2015.

Net sales increased 65.9% to $5.00 billion from $3.01 billion in the prior year’s second quarter. The $1.99 billion increase was the result of an incremental $1.80 billion in net sales from Family Dollar stores, sales from new Dollar Tree stores, and a 1.2% same-store sales increase, on a constant currency basis. Same-store sales increased 2.7%, on a constant currency basis, in the prior-year period. Adjusted for the impact of Canadian currency fluctuations, the same-store sales increase was 1.1%. The positive same-store sales growth was driven by increases in customer count and average ticket.

Gross profit increased by $657.2 million, or 76.8%, to $1.51 billion in the second quarter compared to $855.2 million in the prior year’s second quarter. The increase included an incremental $588.4 million of gross profit for Family Dollar and a 9.2% increase in Dollar Tree’s gross profit for the quarter. As a percent of sales, gross margin increased to 30.3% compared to 28.4% in the prior year. The prior year’s second quarter included $60.0 million of markdown expense related to product assortment rationalization and planned liquidations at Family Dollar.

Selling, general and administrative expenses were 23.1% of sales compared to 24.3% of sales in the prior year’s second quarter. Excluding $17.7 million of acquisition-related costs from the prior year’s period, selling, general and administrative expenses, as a percent of sales, improved to 23.1% from 23.7%. This 60 basis point improvement was the result of lower payroll and operating and corporate expenses, as a percent of sales, partially offset by higher store repairs and maintenance expenses and depreciation expense.

Operating income increased 189.5% to $357.2 million compared with $123.4 million in the same period last year. Operating income margin increased to 7.1% in the current quarter from 4.1% in last year’s quarter. This increase in operating income is the result of an incremental $189.7 million of operating income in the Family Dollar segment, and a $44.1 million increase in operating income in the Dollar Treesegment.

The Company’s effective tax rate for the quarter was 36.9% compared to a benefit of 31.1% in the prior year period. The increase is primarily attributable to a pre-tax loss in the second quarter of 2015.

Net income compared to the prior year’s second quarter increased $268.2 million to $170.2 million, and diluted earnings per share increased to $0.72.

Bob Sasser, Chief Executive Officer, stated, “I am very pleased with the Company’s overall performance in our second quarter. Through what continues to be a challenging retail sales environment, we delivered gross margin improvement and managed expenses effectively to deliver earnings at the top end of our guidance range. In our Dollar Tree segment, we improved our operating margin and delivered our 34th consecutive quarter of positive same-store sales.”

Sasser added, “Just over a year ago, we completed our acquisition of Family Dollar and our integration continues to progress as planned. The stores are cleaner, the values are greater and our merchandise assortments are improving. Additionally, we are taking the necessary steps to develop our shared services support model, and are continuing our focus on cost-related synergy capture. As a combined organization, we are well-positioned to better serve more customers, generate significant cash flows and deliver long-term value to our shareholders.”

During the quarter, the Company opened 156 stores, expanded or relocated 52 stores, and closed 17 stores. Additionally, as part of its re-banner initiative, the Company opened 47 former Family Dollar store locations as new Dollar Tree stores. The Company also converted the remaining 32 Deals stores to Dollar Tree stores. Retail selling square footage at the end of the quarter was approximately 110.8 million square feet.

First Six Months Results

Consolidated net sales increased 94.3% to $10.08 billion from $5.19 billion in the first six months of 2015. The $4.89 billion increase was the result of $4.50 billion in incremental net sales from Family Dollar stores, sales from new Dollar Tree stores, and a 1.7% same-store sales increase, on a constant currency basis. Adjusted for the impact of Canadian currency fluctuations, the same-store sales increase was 1.6%.

Gross profit increased $1.46 billion, or 91.2%, to $3.07 billion from $1.60 billion in the first six months of 2015. As a percent of sales, gross margin decreased by 50 basis points to 30.4% compared to the prior year period.

Selling, general and administrative expenses were 22.7% of sales compared to 24.1% of sales in the first six months of 2015. Excluding $28.1 million of acquisition-related costs from the first six months of 2015, selling, general and administrative expenses, as a percent of sales, improved to 22.7% from 23.5%.

Net income increased $431.3 million compared to the prior year’s first six months, resulting in net income of $1.70 per diluted share.

Company Outlook

The Company estimates consolidated net sales for the third quarter of 2016 to range from $5.02 billion to $5.10 billion, based on a low single-digit increase in same-store sales. Diluted earnings per share are estimated to be in the range of $0.76 to $0.82.

Consolidated net sales for full-year 2016 are now expected to range between $20.69 billion and $20.87 billion compared to the Company’s previously expected range of $20.79 billion to $21.08 billion. This estimate is based on a low single-digit increase in same-store sales, and 4.0% square footage growth. The Company now anticipates net income per diluted share for full-year 2016 will range between $3.67and $3.82. This compares to its previous EPS guidance range of $3.58 to $3.80.

Conference Call Information

On Thursday, August 25, 2016, the Company will host a conference call to discuss its earnings results at 9:00 a.m. Eastern Time. The telephone number for the call is 888-427-9376. A recorded version of the call will be available until midnight Thursday, September 1, 2016 and may be accessed by dialing 888-203-1112. The access code is 1772942. A webcast of the call is accessible through Dollar Tree’s website, and will remain online until Thursday, September 1, 2016.

Dollar Tree, a Fortune 200 Company, operated 14,129 stores across 48 states and five Canadian provinces as of July 30, 2016. Stores operate under the brands of Dollar Tree, Family Dollar, and Dollar Tree Canada. To learn more about the Company, visit www.DollarTree.com.

A WARNING ABOUT FORWARD-LOOKING STATEMENTS: Our press release contains “forward-looking statements” as that term is used in the Private Securities Litigation Reform Act of 1995. Forward-looking statements address future events, developments or results and typically use words such as believe, anticipate, expect, intend, plan, forecast, or estimate. For example, our forward-looking statements include statements regarding third quarter 2016 and full-year 2016 net sales and same-store sales, third quarter 2016 and full-year 2016 diluted earnings per share, square footage growth, the benefits, results, and effects of the merger including synergies, and future financial and operating results and shareholder value. For a discussion of the risks, uncertainties and assumptions that could affect our future events, developments or results, you should carefully review the “Risk Factors,” “Business” and “Management’s Discussion and Analysis of Financial Condition and Results of Operations” sections in our Annual Report on Form 10-K filed March 28, 2016 and other filings with the Securities and Exchange Commission. We are not obligated to release publicly any revisions to any forward- looking statements contained in this press release to reflect events or circumstances occurring after the date of this report and you should not expect us to do so.

Contact:
Randy Guiler
757-321-5284
Vice President, Investor Relations
www.DollarTree.com

Source: Dollar Tree, Inc.

Ulta Beauty announces 2Q and 1H FY2016 financial results

BOLINGBROOK, Ill, 2016-Aug-27 — /EPR Retail News/ — Ulta Beauty (NASDAQ:ULTA) today (Aug. 25, 2016) announced financial results for the thirteen week period (“Second Quarter”) and twenty-six week period (“First Six Months”) ended July 30, 2016, which compares to the same periods ended August 1, 2015.

“The Ulta Beauty team achieved another quarter of excellent top and bottom line performance, while making significant progress on many elements of our growth strategy,” said Mary Dillon, Chief Executive Officer. “Our second quarter results reflect a strong pipeline of newness and innovation in merchandising, progress in growing our brand awareness, major milestones related to our loyalty program, continued rapid growth in our e-commerce business, and successful execution of our supply chain investments.”

For the Second Quarter

  • Net sales increased 21.9% to $1,069.2 million from $877.0 million in the second quarter of fiscal 2015;
  • Comparable sales (sales for stores open at least 14 months and e-commerce sales) increased 14.4% compared to an increase of 10.1% in the second quarter of fiscal 2015. The 14.4% comparable sales increase was driven by 9.7% growth in transactions and 4.7% growth in average ticket;
  • Retail comparable sales increased 12.6%, including salon comparable sales growth of 8.0%;
  • Salon sales increased 14.3% to $59.0 million from $51.6 million in the second quarter of fiscal 2015;
  • E-commerce sales grew 54.9% to $55.9 million from $36.1 million in the second quarter of fiscal 2015, representing 180 basis points of the total company comparable sales increase of 14.4%;
  • Gross profit increased 110 basis points to 36.0% from 34.9% in the second quarter of fiscal 2015, due to improvements in merchandise margins and leverage in fixed store costs, partly offset by planned supply chain deleverage related to our new distribution centers;
  • Selling, general and administrative (SG&A) expense as a percentage of net sales increased 110 basis points to 22.1%, compared to 21.0% in the second quarter of fiscal 2015, due to increased headcount to support our growth initiatives and an impairment charge associated with the closure of our Chicago State Street store, due to damage resulting from construction in an adjacent building;
  • Pre-opening expenses increased to $4.7 million, compared to $4.1 million in the second quarter of fiscal 2015. Real estate activity in the second quarter of fiscal 2016 included 24 new stores, one relocation and five remodels compared to 20 new stores, one relocation and two remodels in the second quarter of fiscal 2015;
  • Operating income increased 21.4% to $143.8 million, or 13.5% of net sales, compared to $118.5 million, or 13.5% of net sales, in the second quarter of fiscal 2015;
  • Net income increased 21.3% to $90.0 million compared to $74.2 million in the second quarter of fiscal 2015; and
  • Income per diluted share increased 24.3% to $1.43 compared to $1.15 in the second quarter of fiscal 2015.

For the First Six Months

  • Net sales increased 22.8% to $2,142.9 million from $1,745.1 million in the first six months of fiscal 2015;
  • Comparable sales (sales for stores open at least 14 months and e-commerce sales) increased 14.8% compared to an increase of 10.8% in the first six months of fiscal 2015. The 14.8% comparable sales increase was driven by 10.4% growth in transactions and 4.4% growth in average ticket;
  • Retail comparable sales increased 13.3%, including salon comparable sales growth of 7.9%;
  • Salon sales increased 14.5% to $117.9 million from $102.9 million in the first six months of fiscal 2015;
  • E-commerce comparable sales grew 46.0% to $116.9 million from $80.1 million in the first six months of fiscal 2015, representing 150 basis points of the total company comparable sales increase of 14.8%;
  • Gross profit increased 130 basis points to 36.2% from 34.9% in the first six months of fiscal 2015;
  • SG&A expense as a percentage of net sales increased 70 basis points to 22.3% compared to 21.6% in the first six months of fiscal 2015;
  • Pre-opening expenses were equal to the first six months of 2015 at $7.2 million. Real estate activity in the first six months of 2016 included 37 new stores, one relocation and five remodels compared to 44 new stores, two relocations and two remodels in the first six months of fiscal 2015;
  • Operating income increased 28.7% to $290.9 million, or 13.6% of net sales, compared to $226.0 million, or 13.0% of net sales, in the first six months of fiscal 2015;
  • Net income increased 29.0% to $182.0 million compared to $141.1 million in the first six months of fiscal 2015; and
  • Income per diluted share increased 32.0% to $2.89 compared to $2.19 in the first six months of fiscal 2015.

Balance Sheet

Merchandise inventories at the end of the second quarter of fiscal 2016 totaled $930.2 million, compared to $705.7 million at the end of the second quarter of fiscal 2015, representing an increase of $224.5 million. Average inventory per store increased 18.7%, compared to the second quarter of fiscal 2015. The increase in inventory was primarily driven by 90 net new stores, the opening of the Company’s fourth and fifth distribution centers in Greenwood, Indiana and Dallas, Texas, investments in inventory to ensure high in-stock levels to support sales growth, and incremental inventory for new brands and in-store prestige brand boutiques. Average inventory per store, excluding the investment in the new Dallas, Texas distribution center, increased 14.5%.

The Company ended the second quarter of fiscal 2016 with $304.1 million in cash and short-term investments.

Share Repurchase Program

During the second quarter, the Company repurchased 107,725 shares of its stock at a cost of $25.8 million under its 10b5-1 plan and completed the accelerated share repurchase (ASR) under an agreement entered into in March 2016. Under the ASR agreement, the Company paid $200 million and received initial delivery of 851,653 shares in the first quarter of 2016, which were retired and represented 80% of the total shares the Company expected to receive based on the market price at the time of the initial delivery. In May 2016, the ASR settled and an additional 153,418 shares were delivered to the Company and retired. The final number of shares delivered upon settlement was determined with reference to the average price of the Company’s common stock over the term of the agreement.

Year to date, including the ASR and activity under our 10b5-1 plan, the Company has repurchased 1,270,552 shares at an average price of $198.69. As of July 30, 2016, approximately$193 million remained available under the $425 million share repurchase program announced in March 2016.

Store Expansion

During the second quarter, the Company opened 24 stores located in Asheboro, NC; Baytown, TX; Beavercreek, OH; Canton Township, MI; Chambersburg, PA; Cincinnati, OH;Downey, CA; Elko, NV; Fort Collins, CO; Glenwood Springs, CO; Joliet, IL; King of Prussia, PA; Las Vegas, NV; Lodi, CA; Lufkin, TX; Naples, FL; Norwalk, CT; Oklahoma City, OK;Omaha, NE; Pittsburgh, PA; Porterville, CA; Salinas, CA; Tampa, FL and Yulee, FL. In addition, the Company closed three stores during the quarter. The Company ended the second quarter with 907 stores and square footage of 9,555,192, representing an 11% increase in square footage compared to the second quarter of fiscal 2015.

Outlook

For the third quarter of fiscal 2016, the Company currently expects net sales in the range of $1,072 million to $1,090 million, compared to actual net sales of $910.7 million in the third quarter of fiscal 2015. Comparable sales for the third quarter of 2016, including e-commerce sales, are expected to increase 11% to 13%. The Company reported a comparable sales increase of 12.8% in the third quarter of 2015.

Income per diluted share for the third quarter of fiscal 2016 is estimated to be in the range of $1.25 to $1.30. This compares to income per diluted share for the third quarter of fiscal 2015 of $1.11.

The Company is raising its previously announced fiscal 2016 guidance. The Company plans to:

  • achieve comparable sales growth of approximately 11% to 13%, including the impact of the e-commerce business, compared to previous guidance of 10% to 12%;
  • increase total sales in the high teens percentage range;
  • grow e-commerce sales in the 40% range;
  • expand square footage by approximately 11% with the opening of 100 net new stores;
  • remodel 12 locations;
  • deliver earnings per share growth in the low to mid-twenties percentage range, compared to previous guidance of low twenties percentage range, including the impact of the new Dallas distribution center, the accelerated rollout of prestige brand boutiques, the accelerated share repurchase program, and continued open market share repurchases; and
  • incur capital expenditures in the $390 million range in fiscal 2016, compared to $299 million in fiscal 2015. The planned increase in capital expenditures includes approximately $80 million to fund an accelerated rollout of prestige brand boutiques and enhancements to the Ulta Beauty Collection and fragrance fixtures in hundreds of stores.

Conference Call Information

A conference call to discuss second quarter results is scheduled for today, August 25, 2016, at 5:00 p.m. Eastern Time. Investors and analysts interested in participating in the call are invited to dial (877) 705-6003. The conference call will also be web-cast live at http://ir.ulta.com and remain available for 90 days. A replay of this call will be available until 11:59 p.m. (ET) on September 8, 2016 and can be accessed by dialing (877) 870-5176 and entering conference ID number 13642433.

About Ulta Beauty

Ulta Beauty (NASDAQ: ULTA) is the largest beauty retailer in the United States and the premier beauty destination for cosmetics, fragrance, skin, hair care products and salon services. Since opening its first store in 1990, Ulta Beauty has grown to become the top national retailer providing All Things Beauty, All in One Place™. The Company offers more than 20,000 products from over 500 well-established and emerging beauty brands across all categories and price points, including Ulta Beauty’s own private label. Ulta Beauty also offers a full-service salon in every store featuring hair, skin and brow services. Ulta Beauty is recognized for its commitment to personalized service, fun and inviting stores and its industry-leading ULTA mate Rewards loyalty program. As of July 30, 2016 Ulta Beauty operates 907 retail stores across 48 states and the District of Columbia and also distributes its products through its website, which includes a collection of tips, tutorials and social content. For more information, visit www.ulta.com.

Forward-Looking Statements

This press release contains forward-looking statements within the meaning of Section 21E of the Securities Exchange Act of 1934, as amended, and the safe harbor provisions of the Private Securities Litigation Reform Act of 1995, which reflect our current views with respect to, among other things, future events and financial performance. You can identify these forward-looking statements by the use of forward-looking words such as “outlook,” “believes,” “expects,” “plans,” “estimates,” “targets,” “strategies” or other comparable words. Any forward-looking statements contained in this press release are based upon our historical performance and on current plans, estimates and expectations. The inclusion of this forward-looking information should not be regarded as a representation by us or any other person that the future plans, estimates, targets, strategies or expectations contemplated by us will be achieved. Such forward-looking statements are subject to various risks and uncertainties, which include, without limitation: the impact of weakness in the economy; changes in the overall level of consumer spending; the possibility that we may be unable to compete effectively in our highly competitive markets; the possibility that cyber security breaches and other disruptions could compromise our information or result in the unauthorized disclosure of confidential information; the possibility that the capacity of our distribution and order fulfillment infrastructure and the performance of our newly opened distribution centers may not be adequate to support our recent growth and expected future growth plans; our ability to gauge beauty trends and react to changing consumer preferences in a timely manner; our ability to attract and retain key executive personnel; customer acceptance of our rewards program and technological and marketing initiatives; our ability to sustain our growth plans and successfully implement our long-range strategic and financial plan; the possibility that our continued opening of new stores could strain our resources and have a material adverse effect on our business and financial performance; the possibility of material disruptions to our information systems; changes in the wholesale cost of our products; the possibility that new store openings and existing locations may be impacted by developer or co-tenant issues; weather conditions that could negatively impact sales; our ability to successfully execute our common stock repurchase program or implement future common stock repurchase programs; and other risk factors detailed in our public filings with the Securities and Exchange Commission (the “SEC”), including risk factors contained in our Annual Report on Form 10-K for the fiscal year ended January 30, 2016, as such may be amended or supplemented in our subsequently filed Quarterly Reports on Form 10-Q. Our filings with the SEC are available at www.sec.gov. Except to the extent required by the federal securities laws, the Company does not undertake to publicly update or revise its forward-looking statements, whether as a result of new information, future events or otherwise.

Contact:

Scott Settersten
Chief Financial Officer
(630) 410-4807

Laurel Lefebvre
Vice President, Investor Relations
(630) 410-5230

Karen May
Director, Public Relations
(630) 410-5457

Source: Ulta Beauty

GameStop Corp. announces sales and earnings for the second quarter ended July 30, 2016

GRAPEVINE, TX , 2016-Aug-27 — /EPR Retail News/ — GameStop Corp. (NYSE: GME), a global family of specialty retail brands that makes the most popular technologies affordable and simple, today ( 08/25/16) reported sales and earnings for the second quarter ended July 30, 2016.

The following table summarizes the second quarter results for fiscal 2016 and 2015 ($ in millions, except per share amounts):

Quarter Ended
July 30, 2016 Aug. 1, 2015 Change
Net Sales $1,631.8 $1,761.9 -7.4%
Same store sales* -10.6% 8.1%
GAAP Net Income $27.9 $25.3 10.3%
GAAP Diluted EPS $0.27 $0.24 12.5%
Non-GAAP Net Income $27.9 $33.1 -15.7%
Non-GAAP Diluted EPS $0.27 $0.31 -12.9%
Technology Brands Operating Earnings $13.9 $0.4 3,375.0%
*excludes Technology Brands stores

Paul Raines, chief executive officer, stated, “As expected, the continued growth and increased profit contribution of our non-physical gaming businesses drove our second quarter results. Tech Brands sales grew more than 50%, omni-channel sales increased 16%, Collectibles sales more than doubled and year-to-date, more than half of GameStop’s operating earnings have come from non-physical gaming categories. These new businesses offset a tough quarter for video gaming and prove that our diversification strategy is succeeding.”

Second Quarter Results

Total global sales decreased 7.4% to $1.63 billion, while consolidated comparable store sales declined 10.6% (-12.5% in the U.S. and -5.9% internationally). Video game sales were impacted by a lack of new titles to offset strong Q2 2015 title launches, such as Batman: Arkhman Knight and Elder Scrolls Online, and a decline in hardware sales caused primarily by new information being released about upcoming new consoles. Pre-owned sales significantly outperformed the new side of the video game business, declining only 3.2% compared to the second quarter of 2015.

In July, GameStop, via its GameTrust division and partnership with Insomniac Games, launched its first Indie game, Song of the Deep. GameTrust has several new titles in development, including De-formers, set to launch this holiday.

Non-GAAP digital receipts rose 3.3%, to $205.6 million, driven by sales of DLC and console digital currency. GAAP digital sales decreased 12.7%.

Sales in the Mobile and Consumer Electronics category increased 43.0% to $203.3 million, as Technology Brands revenues increased 54.6% to $175.9 million. Technology Brands operating earnings were $13.9 million compared to $400,000 in the prior year quarter. Overall, this segment contributed 23.8% of the company’s second quarter operating earnings. Technology Brands is on track to deliver between $85 million and $100 million of operating earnings in fiscal 2016.

Collectibles sales rose 119.5% to $90.0 million, driven by sales of ThinkGeek.com, various Pokémon products, assorted Five Nights at Freddy’s skus and character pop vinyls from recently released movies like Suicide Squad. The company added ten Collectibles stores during the quarter, bringing the total global portfolio to 47 stores.

GameStop’s net earnings for the second quarter were $27.9 million, or $0.27 per diluted share, compared to diluted earnings per share of $0.24 in the prior year quarter. Non-GAAP earnings for the quarter were $27.9 million, or $0.27 per diluted share, compared to Non-GAAP earnings of $33.1 million, or $0.31 per diluted share, in the prior year quarter. Last year’s reconciliation of GAAP net income to non-GAAP net income is included with this release (Schedule III).

Capital Allocation Update

On August 22, 2016, GameStop’s board of directors declared a quarterly cash dividend of $0.37 per common share payable on September 22, 2016 to shareholders of record as of the close of business on September 9, 2016. As previously announced, GME acquired 507 new AT&T Mobility stores through the acquisition of three national AT&T authorized retailers for approximately $441 million.

Earnings Guidance

For the third quarter of fiscal 2016, GameStop expects comparable store sales to range from -2.0% to 1.0%. Diluted earnings per share are expected to range from $0.53 to $0.58. For fiscal 2016, the company is reiterating its full year diluted earnings per share guidance of $3.90 to $4.05 and comparable store sales are now expected to range of -4.5% to -1.5%.

Note: The guidance is based on weighted average shares outstanding of 104,500,000.

Conference Call Information

A conference call with GameStop Corp.’s management is scheduled for August 25, 2016 at 4:00 p.m. CT to discuss the company’s financial results. The phone number for the call is 888-500-6948 and the pass code is 5743731. This call, along with supplemental information, can also be accessed at GameStop Corp.’s investor relations home page at http://investor.GameStop.com/. The conference call will be archived for two months on GameStop’s corporate website.

About GameStop

GameStop Corp. (NYSE: GME), a Fortune 500 company headquartered in Grapevine, Texas, is a global, multichannel video game, consumer electronics and wireless services retailer. GameStop operates more than 7,500 stores across 14 countries. The company’s consumer product network also includes www.gamestop.com; www.Kongregate.com, a leading browser-based game site; Game Informer® magazine, the world’s leading print and digital video game publication; and ThinkGeek, www.thinkgeek.com, the premier retailer for the global geek community featuring exclusive and unique video game and pop culture products. In addition, our Technology Brands segment includes Simply Mac and Spring Mobile stores. Simply Mac, www.simplymac.com, operates 72 stores, selling the full line of Apple products, including laptops, tablets, and smartphones and offering Apple certified warranty and repair services. Spring Mobile, www.springmobile.com, sells all of AT&T’s products and services, including DIRECTV through its 1,424 AT&T branded stores and offers pre-paid wireless services, devices and related accessories through its 70 Cricket branded stores in select markets in the U.S.

General information about GameStop Corp. can be obtained at the company’s corporate website. Follow @GameStop on Twitter and find GameStop on Facebook at www.facebook.com/GameStop.

Non-GAAP Measures

As a supplement to our financial results presented in accordance with U.S. generally accepted accounting principles (GAAP), GameStop may use certain non-GAAP measures, such as digital receipts and constant currency, to provide a clearer perspective of the current operating performance of the company. GameStop defines digital receipts as the full amount paid by the customer for digital content at the time of sale and/or the value attributed to digital content when physical and digital products are sold combined. Results reported as constant currency exclude the impact of fluctuations in foreign currency exchange rates by converting our local currency financial results using the prior period exchange rates and comparing these adjusted amounts to our current period reported results. Our definition and calculation of constant currency information may differ from that of other companies. Non-GAAP financial measures should be viewed in addition to, and not as an alternative for, the company’s reported GAAP financial results.

Safe Harbor

This presentation contains forward-looking statements within the meaning of the Private Securities Litigation Reform Act of 1995. Such statements may include, but are not limited to, the outlook for the third quarter and fiscal 2016, future financial and operating results and projections, projected store openings, timing and terms of potential acquisitions, the company’s plans, objectives, expectations and intentions, and other statements that are not historical facts. Such statements are based upon the current beliefs and expectations of GameStop’s management and are subject to significant risks and uncertainties. Actual results may differ from those set forth in the forward-looking statements. GameStop undertakes no obligation to publicly update or revise any forward-looking statements. The following factors, among others, could cause actual results to differ from those set forth in the forward-looking statements: the inability to obtain sufficient quantities of product to meet consumer demand, including console hardware and accessories; the timing of release and consumer demand for new and pre-owned video game titles; our ability to continue to expand, and successfully open and operate new stores for, our collectibles and tech brands businesses; risks associated with achievement of anticipated financial and operating results from acquisitions; our ability to sustain and grow our console digital video game sales; the risks associated with international operations, wireless industry partnerships and operations and the completion and integration of acquisitions; increased competition and changing technology in the video game industry, including browser and mobile games and digital distribution of console games, and the impact of that competition and those changes on physical video game sales; and economic, regulatory and other events, including litigation, that could reduce or impact consumer demand or affect the company’s business. Additional factors that could cause GameStop’s results to differ materially from those described in the forward-looking statements can be found in GameStop’s Annual Report on Form 10-K, as amended, for the fiscal year ended Jan. 30, 2016 filed with the SEC and available at the SEC’s Internet site at http://www.sec.gov or http://investor.GameStop.com.

Contact:
Matt Hodges
Vice President
Corporate Communications & Investor Relations
GameStop Corp.
(817) 424-2130

Source: GameStop Corporation

Tiffany & Co. reports 2Q and 1H FY2016 financial results

NEW YORK, 2016-Aug-27 — /EPR Retail News/ — Tiffany & Co. (NYSE:TIF) reported its financial results for the three months (“second quarter”) and six months (“first half”) ended July 31, 2016. Worldwide net sales were below the prior year in both periods, which management attributed to declines in sales to both local customers and foreign tourists in most regions. Net earnings as reported in the second quarter were above the prior year (but declined when compared with adjusted net earnings in the equivalent prior-year period – see “Non-GAAP Measures”) and declined in the first half. In both periods, earnings benefited from higher gross margins, but there was a lack of sales leverage on operating expenses.

In the second quarter:

  • Worldwide net sales declined 6% to $932 million and comparable store sales declined 8%. On a constant-exchange-rate basis that excludes the effect of translating foreign-currency-denominated sales into U.S. dollars (see “Non-GAAP Measures”), worldwide net sales and comparable store sales declined 6% and 9%, respectively.
  • Net earnings rose 1% to $106 million, or $0.84 per diluted share, from $105 million, or $0.81, in the prior year. Net earnings declined 5% from the prior-year period’s $111 million, or $0.86 per diluted share, which excludes a specific charge in that period (see “Non-GAAP Measures”).

In the first half:

  • Worldwide net sales of $1.8 billion were 7% below the prior year and comparable store sales declined 9%. On a constant-exchange-rate basis, worldwide net sales and comparable store sales declined 6% and 9%, respectively.
  • Net earnings of $193 million, or $1.53 per diluted share, included a tax benefit of $0.05 per diluted share in the first quarter related to the settlement of a tax examination. This compared with the prior year’s $210 million, or $1.62 per diluted share, as reported, and $216 million, or $1.67 per diluted share, when adjusted for the charge referenced above (see “Non-GAAP Measures”).

Frederic Cumenal, chief executive officer, said, “The global environment continues to reflect well known challenges that we believe have had broad effects on spending by local customers, as well as foreign tourists, especially from China. We are managing expenses efficiently, but also maintaining our marketing spending as a percentage of sales and continuing to invest in key strategic initiatives and opportunities to further strengthen Tiffany’s competitive position among global luxury brands. By delivering extraordinary products and experiences to our customers around the world, we remain focused on growing sales, operating margins and earnings, and creating greater value for stockholders.”

Net sales by region were as follows:

  • In the Americas, total sales of $434 million in the second quarter and $837 million in the first half were both 9% below last year, with declines of 9% and 10%, respectively, in comparable store sales. On a constant-exchange-rate basis, total sales and comparable store sales declined 8% and 9%, respectively, in both the second quarter and first half. Management attributed the declines to lower spending by U.S. customers as well as by Chinese and other foreign tourists.
  • In the Asia-Pacific region, total sales of $230 million in the second quarter and $469 million in the first half were 6% and 7%, respectively, lower than the prior year, and comparable store sales declined 12% and 13%, respectively. On a constant-exchange-rate basis, total sales and comparable store sales declined 3% and 9%, respectively, in the second quarter and 4% and 11%, respectively, in the first half. Sales growth in China and Korea was offset by a continuation of significant declines in Hong Kong and more moderate declines in most other markets.
  • In Japan, total sales increased 10% to $138 million in the second quarter and rose 9% to $269 million in the first half due to comparable store sales growth of 13% and 12%, respectively. However, on a constant-exchange-rate basis, total sales and comparable store sales declined 5% and 3%, respectively, in the second quarter and declined 2% and rose 1%, respectively, in the first half. Management noted lower spending by Chinese tourists in both periods.
  • In Europe, total sales declined 12% to $111 million in the second quarter and 11% to $208 million in the first half, due to respective declines of 17% and 16% in comparable store sales. On a constant-exchange-rate basis, total sales and comparable store sales declined 8% and 13%, respectively, in the second quarter and 7% and 13%, respectively, in the first half. Lower sales in continental Europe were attributed by management to weak demand by foreign tourists and local customers, in contrast to better performance in the United Kingdom.
  • Other sales declined 3% to $18 million in the second quarter and 20% to $40 million in the first half, reflecting comparable store sales declines of 22% and 21%, respectively. Management noted lower retail sales in the United Arab Emirates(“UAE”) and an increase in wholesale sales of diamonds.
  • Tiffany opened four Company-operated stores in the second quarter and closed one existing location. At July 31, 2016, the Company operated 311 stores (125 in the Americas, 83 in Asia-Pacific, 55 in Japan, 43 in Europe, and five in theUAE), compared with 304 stores a year ago (124 in the Americas, 79 in Asia-Pacific, 56 in Japan, 40 in Europe, and five in the UAE).

Other financial highlights:

  • Gross margin (gross profit as a percentage of net sales) increased to 61.9% in the second quarter and 61.6% in the first half, from 59.9% and 59.5% in the respective prior-year periods. The increases were due to lower product input costs, changes in product sales mix and price increases taken in the past year.
  • SG&A expenses declined 4% in the second quarter and 1% in the first half, reflecting lower variable labor-related costs, lower sales-related variable costs, lower marketing expenses and higher store-related costs. Excluding the effect of a specific charge in the prior year period, SG&A expenses declined 2% in the second quarter and increased less than one percent in the first half.
  • The effective tax rates were 34.5% in the second quarter and 32.1% in the first half, compared with 34.2% and 34.4%, respectively, in the comparable prior-year periods. The decline in the first half rate was due to a benefit related to the conclusion of a tax examination.
  • Net inventories at July 31, 2016 were 1% lower than at July 31, 2015.
  • Capital expenditures of $101 million in the first half were slightly higher than $98 million in last year’s first half.
  • The Company maintained an active pace of share repurchases in the second quarter, buying approximately 1.1 million shares of its Common Stock at an average cost of approximately $63 per share; in the first half the Company bought approximately 2.3 million shares at an average cost of approximately $65 per share. At July 31, 2016, $344 million remained available for repurchases under a program that authorizes the repurchase of up to $500 million of the Company’s Common Stock and that expires on January 31, 2019.
  • Cash and cash equivalents and short-term investments totaled $720 million at July 31, 2016, versus $771 million at July 31, 2015. Total short-term and long-term debt as a percentage of stockholders’ equity was 37% at both July 31, 2016 and 2015.

Outlook:

For the full 2016 fiscal year, management is maintaining its outlook to expect: (i) worldwide net sales declining by a low single-digit percentage from the prior year and (ii) earnings per diluted share declining by a mid-single-digit percentage from 2015’s adjusted earnings of $3.83 per diluted share (which excluded loan impairment and certain staffing and occupancy charges – see “Non-GAAP Measures”). These expectations are approximations and are based on the Company’s plans and assumptions, including: (i) worldwide gross retail square footage increasing 2%, net through 11 openings, 6 relocations and 9 closings; (ii) operating margin below the prior year’s 19.7% (excluding the prior year’s charges – see “Non-GAAP Measures”) due to an anticipated increase in gross margin (although at a considerably lesser rate in the second half than in the first half of the year) more than offset by SG&A expense growth; (iii) interest and other expenses, net unchanged from 2015; (iv) an effective income tax rate slightly lower than the prior year; (v) the U.S. dollar unchanged from current spot rates for the balance of the year; and (vi) weighted average diluted shares outstanding modestly lower than in fiscal 2015.

Management also expects for the full 2016 fiscal year: (i) net cash provided by operating activities of at least $660 million and (ii) free cash flow (net cash provided by operating activities less capital expenditures) of at least $400 million. These expectations are also based on the Company’s plans and assumptions, including: (i) net inventories unchanged from the prior year, (ii) capital expenditures of $260 million and (iii) net earnings in line with management’s expectations as described above.

Today’s Conference Call:

The Company will conduct a conference call today at 8:30 a.m. (Eastern Time) to review actual results and the outlook. Please click on http://investor.tiffany.com (“Events and Presentations”).

Next Scheduled Announcement:

The Company expects to report third quarter results on Tuesday November 29th before the market opens. To be notified of future announcements, please register at http://investor.tiffany.com (“E-Mail Alerts”).

Tiffany is the internationally-renowned jeweler founded in New York in 1837. Through its subsidiaries, Tiffany & Co. manufactures products and operates TIFFANY & CO. retail stores worldwide, and also engages in direct selling through Internet, catalog and business gift operations. For additional information, please visit www.tiffany.com or call our shareholder information line at 800-TIF-0110.

Forward-Looking Statements:

The historical trends and results reported in this document and on our second quarter earnings call should not be considered an indication of future performance. Further, statements contained in this document and made on such call that are not statements of historical fact, including those that refer to plans, assumptions and expectations for the current fiscal year and future periods, are forward-looking statements within the meaning of the Private Securities Litigation Reform Act of 1995. Forward-looking statements include, but are not limited to, the statements under “Outlook” as well as statements that can be identified by the use of words such as ‘expects,’ ‘projects,’ ‘anticipates,’ ‘assumes,’ ‘forecasts,’ ‘plans,’ ‘believes,’ ‘intends’, ‘estimates,’ ‘pursues,’ ‘continues,’ ‘outlook,’ ‘may,’ ‘will,’ ‘can,’ ‘should’ and variations of such words and similar expressions. Examples of forward-looking statements include, but are not limited to, statements we make regarding the Company’s plans, assumptions, expectations, beliefs and objectives with respect to store openings and closings; product introductions; sales; sales growth; retail prices; gross margin; operating margin; expenses; interest and other expenses, net; effective income tax rate; net earnings and net earnings per share; share count; inventories; capital expenditures; cash flow; liquidity; currency translation; growth opportunities; the collectability of amounts due under financing arrangements with diamond mining and exploration companies; and certain ongoing or planned product, marketing, retail, manufacturing and other operational and strategic initiatives.

These forward-looking statements are based upon the current views and plans of management, speak only as of the date on which they are made and are subject to a number of risks and uncertainties, many of which are outside of our control. Actual results could therefore differ materially from the planned, assumed or expected results expressed in, or implied by, these forward-looking statements. While we cannot predict all of the factors that could form the basis of such differences, key factors include, but are not limited to: global macroeconomic and geopolitical developments; changes in interest and foreign currency rates; shifting tourism trends; regional instability, violence (including terrorist activities) and weather conditions that may affect local and tourist consumer spending; changes in consumer confidence, preferences and shopping patterns, as well our ability to accurately predict and timely respond to such changes; shifts in the Company’s product and geographic sales mix; variations in the cost and availability of diamonds, gemstones and precious metals; changes in our competitive landscape; disruptions impacting the Company’s business and operations; gains or losses in the trading value of the Company’s stock, which may impact the amount of stock repurchased; and our ability to successfully control costs and execute on, and achieve the expected benefits from, the operational and strategic initiatives referenced above. Developments relating to these and other factors may also warrant changes to the Company’s operating and strategic plans, including with respect to store openings, closings and renovations, capital expenditures, inventory management, and continuing execution on, or timing of, the aforementioned initiatives. Such changes could also cause actual results to differ materially from the expected results expressed in, or implied by, the forward-looking statements.

Additional information about potential risks and uncertainties that could affect the Company’s business and financial results is included under “Risk Factors” and “Management’s Discussion and Analysis of Financial Condition and Results of Operations” in the Company’s Annual Report on Form 10-K for the fiscal year ended January 31, 2016 and “Management’s Discussion and Analysis of Financial Condition and Results of Operations” in the Company’s most recent quarterly report on Form 10-Q. Readers of these documents should consider the risks, uncertainties and factors outlined above and in the Form 10-K in evaluating, and are cautioned not to place undue reliance on, the forward-looking statements contained herein. The Company undertakes no obligation to update or revise any forward-looking statements to reflect subsequent events or circumstances, except as required by applicable law or regulation.

Contact:

Mark L. Aaron
212-230-5301
mark.aaron@tiffany.com

Source: Tiffany & Co.

Back-to-school shopping has never been easier with Staples mobile iOS app

FRAMINGHAM, Mass., 2016-Aug-27 — /EPR Retail News/ — Staples (NASDAQ: SPLS) today (Aug. 25, 2016) announced a new beta test available on the Staples mobile iOS app. Customers can now send a photo of their child’s back-to-school list via the Staples Easy System on the app and a Staples associate will populate the customer’s shopping cart with everything they need. Back-to-school shopping has never been easier!

Today, many school districts offer a printed list of supplies. Staples is now offering an innovative way for parents to shop with those lists, making it easier than ever to get back-to-school shopping done. Parents will snap a photo of their back-to-school list, send it to a Staples associate via the Staples Easy System (on the app) and then be provided with the best product options within 24-48 hours. Once the list has been populated, customers can choose to buy now or customize their items in the cart, and if they want to pick up their order in store where available or have it shipped to them.

“We listened to customer feedback about their limited time for back-to-school shopping and delivered an experience utilizing the power of mobile,” said Faisal Masud, executive vice president, eCommerce and customer experience, Staples. “We know parents are busy and the process of back-to-school shopping, especially if there are multiple children involved, can be time-consuming. This new experience enables us to do the hard work on behalf of our customers and we’re already seeing 10 percent of our iOS users interact with the chat feature on a daily basis.”

The Staples Easy System uses computer vision, artificial intelligence, crowd sourced data, and mobile interfaces to enable this chat-based experience, which also makes it easy for customers to ask Staples for any changes or other service questions. The beta test is now in effect for select customers, and has applications beyond just back-to-school shopping, as businesses can use the feature to snap a photo of their office or breakroom to get product re-ordering suggestions.

This beta test program is one of many new mobile app features that Staples is initiating to make easier shopping happen. It’s the latest addition to a suite of shopping options including stores, Staples.com, Staples mobile website, Buy Online, Pick Up in Store and Staples in-store kiosks.

About Staples, Inc.
Staples retail stores and Staples.com help small business customers make more happen by providing a broad assortment of products, expanded business services and easy ways to shop, all backed with a lowest price guarantee. Staples offers businesses the convenience to shop and buy how and when they want – in store, online, via mobile or though social apps. Staples.com customers can either buy online and pick-up in store or ship for free from Staples.com with Staples Rewards minimum purchase. Expanded services also make it easy for businesses to succeed with in-store Business Centers featuring shipping services and products, copying, scanning, faxing and computer work stations, Tech Services, full-service Print & Marketing Services, Staples Merchant Services, small business lending and credit services.

Staples Business Advantage, the business-to-business division of Staples, Inc., helps mid-market, commercial and enterprise-sized customers make more happen by offering a curated assortment of products and services combined with deep expertise, best-in-class customer service, competitive pricing and state-of-the art-ecommerce site. Staples Business Advantage is the one-source solution for all things businesses need to succeed, including office supplies, facilities cleaning and maintenance, breakroom snacks and beverages, technology, furniture, interior design and Print & Marketing Services. Headquartered outside of Boston, Staples, Inc. operates throughout North and South America, Europe, Asia,Australia and New Zealand. More information about Staples (NASDAQ: SPLS) is available at www.staples.com.

Contact:
Kaitlyn Reardon
508-253-8512
Kaitlyn.Reardon@staples.com

Mark Cautela
508-253-3832
Mark.Cautela@Staples.com

###

Back-to-school shopping has never been easier with Staples mobile iOS app


Source: Staples, Inc.


Signet Jewelers Limited announced its results for the 13 weeks ended July 30, 2016

HAMILTON, Bermuda, 2016-Aug-27 — /EPR Retail News/ — Signet Jewelers Limited (“Signet”) (NYSE: SIG), the world’s largest retailer of diamond jewelry, today ( August 25, 2016) announced its results for the 13 weeks ended July 30, 2016 (“second quarter Fiscal 2017”).

Summary:

  • Same store sales down 2.3%. Total sales $1.4 billion down 2.6%. Total sales at constant exchange rate down 1.3%.
  • Second quarter Fiscal 2017 diluted earnings per share (“EPS”) $1.06. Adjusted EPS $1.14.
  • Zale integration continues to progress well. On track to deliver cumulative synergies of $158 million to $175 million by end of this fiscal year and $225 million to $250 million by end of next fiscal year.
  • Repurchased over 2.8 million shares in second quarter for $250 million along with insider buying.
  • Credit review process proceeding according to plan.
  • Leonard Green & Partners (“LGP”) commits to $625 million convertible preferred investment in Signet.
  • Annual financial guidance revised downward based on current trends.

Mark Light, Chief Executive Officer of Signet Jewelers said, “We are disappointed by our Q2 results and market conditions have been challenging particularly in the energy-dependent regions. This has contributed to a downward revision in our annual guidance.

“We achieved some important wins in the second quarter. Select diamond fashion jewelry, bracelets, and earrings sold well. We saw success in a variety of selling channels including outlets, kiosks, and on-line due to improvements in our consumer websites and mobile sites. The Zale integration is running well and synergies remain on target. We remain confident in the medium and long-term prospects of our business.

“Demonstrating our confidence in our company, we repurchased nearly four percent of our outstanding common stock during the quarter coupled with purchases by our Directors and Officers. As announced, and in a further demonstration of confidence in our company, LGP, one of the world’s preeminent retail investors, agreed to purchase a $625 million stake in Signet. Finally, our credit review process is proceeding according to plan.”

Mr. Light concluded, “We have experience and success in navigating through the kind of uncertain business conditions we are seeing today. We are confident that our organization will do so again this year. We are intensely focused on preparations for the fourth quarter when we will launch new initiatives around merchandising, marketing, digital, and the customer experience. I want to thank all Signet team members for their dedication and hard work as we move in to the all-important holiday season.”

Contact:
Investors:
James Grant
VP Investor Relations
1 330-668-5412

Media:
David Bouffard
VP Corporate Affairs
1 330-668-5369

Source: Signet Jewelers Limited

Leonard Green & Partners to invest $625 million in Signet Jewelers Limited in the form of convertible preferred shares

HAMILTON, Bermuda, 2016-Aug-27 — /EPR Retail News/ — Signet Jewelers Limited (NYSE:SIG), the world’s largest retailer of diamond jewelry, announced today (August 25, 2016 ) that affiliates of Leonard Green & Partners, L.P. (“LGP”), a leading private equity firm, will invest $625 million in the form of convertible preferred shares. Signet will use the proceeds from the LGP investment to fund a repurchase of up to $625 mm in common stock either in the open market or through privately negotiated transactions. In conjunction with this transaction, Signet will expand its Board of Directors from ten to eleven and appoint Jonathan Sokoloff to the Signet Board upon the closing of the transaction, which is expected to occur in the third quarter of FY 2017.

Mark Light, Chief Executive Officer of Signet Jewelers, said, “We are very pleased to announce this strategic partnership with Leonard Green, one of the most experienced and successful investors in the retail industry. For more than 25 years, Leonard Green has successfully partnered with some of the best known companies in the retail sector and worked to create significant shareholder value. We view Leonard Green’s significant investment in Signet as a strong vote of confidence in our business and its long term growth prospects.”

Todd Stitzer, Chairman of Signet Jewelers, said, “We found in Leonard Green a long term partner who will provide a strong foundation to our shareholder base and will bring additional retail and financial expertise to our Board of Directors to help us further grow and shape the Signet portfolio of brands in a continuously evolving retail landscape.”

Jonathan Sokoloff added, “Signet Jewelers is an outstanding company – an innovator in its industry with some of the world’s most recognizable store banners and jewelry brands. We are pleased to make this investment and look forward to our partnership with the Board and management team.”

The investment by Green Equity Investors VI, L.P., an affiliate of LGP, in Signet will include the following terms:

  • $625mm in convertible preference shares
  • The convertible preference shares accrue a 5% p.a. dividend, payable quarterly in arrears, in cash or by increasing the liquidation preference, at the option of Signet
  • The preference shares will be convertible into Signet common shares at a premium of 18% to the volume weighted average price of the common shares for the 20 trading days immediately following Signet’s second quarter earnings announcement on August 25, 2016, with a maximum conversion price of $100 per share
  • LGP will be subject to a two year lock-up period and Signet will also have the right to force conversion after two years subject to Signet’s common shares achieving a specific price threshold

As a part of the transaction, Signet is increasing its Board authorized share repurchase program by $625 million, bringing the total authorization to$1.1 billion when combined with the $511 million remaining under the previously authorized repurchase program. The transaction is expected to close in the third quarter of FY 2017, subject to the receipt of customary regulatory approvals. Additional information regarding the investment will be included in a Form 8-K to be filed today by Signet with the Securities and Exchange Commission.

J.P. Morgan Securities LLC acted as financial advisor and Weil, Gotshal & Manges LLP acted as legal advisor to Signet. Guggenheim Securitiesacted as financial advisor and Latham & Watkins LLP acted as legal advisor to Leonard Green & Partners, L.P.

About Signet
Signet Jewelers Limited is the world’s largest retailer of diamond jewelry. Signet operates approximately 3,600 stores primarily under the name brands of Kay Jewelers, Zales, Jared The Galleria Of Jewelry, H.Samuel, Ernest Jones, Peoples and Piercing Pagoda. Further information on Signet is available at www.signetjewelers.com. See also www.kay.com, www.zales.com, www.jared.com, www.hsamuel.co.ukwww.ernestjones.co.uk, www.peoplesjewellers.com and www.pagoda.com.

About Leonard Green & Partners
Leonard Green & Partners, L.P. is a leading private equity investment firm founded in 1989. Based in Los Angeles, the firm partners with experienced management teams to invest in market-leading companies. Since inception, LGP has invested in over 80 companies in the form of traditional buyouts, going-private transactions, recapitalizations, growth equity, and selective public equity and debt positions. The firm’s primary sectors of focus are consumer/retail, healthcare/wellness, business/consumer services, and distribution. Select past and current investments include Whole Foods Market, Life Time Fitness, Shake Shack, Activision, Jetro Cash & Carry, CHG Healthcare, and Petco. For more information, please visit www.leonardgreen.com.

Safe Harbor Statement
This release contains statements which are forward-looking statements within the meaning of the Private Securities Litigation Reform Act of 1995. These statements, based upon management’s beliefs and expectations as well as on assumptions made by and data currently available to management, appear in a number of places throughout this document and include statements regarding, among other things, Signet’s results of operation, financial condition, liquidity, prospects, growth, strategies and the industry in which Signet operates. The use of the words “expects,” “intends,” “anticipates,” “estimates,” “predicts,” “believes,” “should,” “potential,” “may,” “forecast,” “objective,” “plan,” or “target,” and other similar expressions are intended to identify forward-looking statements. These forward-looking statements are not guarantees of future performance and are subject to a number of risks and uncertainties, including but not limited to general economic conditions, a decline in consumer spending, the merchandising, pricing and inventory policies followed by Signet, the reputation of Signet and its brands, the level of competition in the jewelry sector, the cost and availability of diamonds, gold and other precious metals, regulations relating to customer credit, seasonality of Signet’s business, financial market risks, deterioration in customers’ financial condition, exchange rate fluctuations, changes in Signet’s credit rating, changes in consumer attitudes regarding jewelry, management of social, ethical and environmental risks, security breaches and other disruptions to Signet’s information technology infrastructure and databases, inadequacy in and disruptions to internal controls and systems, changes in assumptions used in making accounting estimates relating to items such as extended service plans and pensions, risks related to Signet being aBermuda corporation, the impact of the acquisition of Zale Corporation on relationships, including with employees, suppliers, customers and competitors, and our ability to successfully integrate Zale Corporation’s operations and to realize synergies from the transaction.

For a discussion of these risks and other risks and uncertainties which could cause actual results to differ materially from those expressed in any forward looking statement, see the “Risk Factors” section of Signet’s Fiscal 2016 Annual Report on Form 10-K filed with the SEC on March 24, 2016. Signet undertakes no obligation to update or revise any forward-looking statements to reflect subsequent events or circumstances, except as required by law.

Contact:

Investors:
James Grant
1-330-668-5412
VP Investor Relations

Media:
David Bouffard
1-330-668-5369
VP Corporate Affairs

Source: Signet Jewelers Limited

Colruyt, OKay and Solucious recall Everyday orange juice 100 % pure squeezed due to presence of yeast saccharomyces

Halle, Belgium, 2016-Aug-27 — /EPR Retail News/ — Following reports of customers, we found the yeast saccharomyces in the 100% pure squeezed orange juice of Everyday (fresh market, plastic 2 l bottle).

Saccharomyces is a yeast that converts sugars into gas making it possible for the bottle to tear or burst open (especially during transport). There is no health risk at all. The orange juice can taste sour, but it can be consumed. Meanwhile, all bottles have been removed from the shelves as a precaution.

Customers who bought this product, are advised to open it carefully outside and to return the empty bottle or their receipt to their Colruyt or OKay store. It will be refunded.

Product description:
Everyday orange juice 100 % pure squeezed (2 l)
Sold at Colruyt, Colruyt Luxembourg, OKay and Solucious.
Article number: 44390.
All batch numbers can be returned.

Frequently Asked Questions:
I bought this product. What do I do?

Since gas develops in the bottle, we advise you to take it outside and open it very slowly to let the gas escape little by little. Return the empty bottle or your receipt to your Colruyt or OKay store. The product will be refunded.

What if I already drank some?
The orange juice can taste a little sour, but there is absolutely no health risk.

What is saccharomyces?
Saccharomyces is a yeast used in the food industry to make beer or bread. Consequently, the consumption of this yeast presents no health risk at all.

Where can I get more information?
You can call our customer service at 02 360 10 40.

For more information, customers can call 02 360 10 40.

Contact:
Press officer
Patricia Verdoodt
Press officer Colruyt Group
Tel.: 0473 92 45 10

###

Colruyt, OKay and Solucious recall Everyday orange juice 100 % pure squeezed due to presence of yeast saccharomyces


Source: Colruyt Group

The Home Depot® CEO Craig Menear and EVP – Merchandising Ted Decker to present at the Goldman Sachs 23rd Annual Global Retailing Conference on September 8, 2016

ATLANTA, 2016-Aug-27 — /EPR Retail News/ — The Home Depot®, the world’s largest home improvement retailer, today (Aug 25, 2016) announced that Craig Menear, chairman, CEO and president, and Ted Decker, executive vice president – Merchandising, will present at the Goldman Sachs 23rd Annual Global Retailing Conference in New York, NY. The presentation will begin at 8:50 a.m. ET on September 8, 2016.

The presentation will be webcast live over the internet at http://ir.homedepot.com. A link will be displayed under “Events and Presentations.” The webcast will be archived and available at the same location approximately one hour after conclusion of the live event.

The Home Depot is the world’s largest home improvement specialty retailer, with 2,276 retail stores in all 50 states, the District of Columbia, Puerto Rico, U.S. Virgin Islands, Guam, 10 Canadian provinces and Mexico. In fiscal 2015, The Home Depot had sales of $88.5 billion and earnings of $7.0 billion. The Company employs more than 385,000 associates. The Home Depot’s stock is traded on the New York Stock Exchange (NYSE: HD) and is included in the Dow Jones industrial average and Standard & Poor’s 500 index.

To learn more and see Team Depot in action, visit www.homedepot.com/teamdepot.

Contact:

Email: investor_relations@homedepot.com
IR Coordinator: 770-384-2871

SOURCE: The Home Depot

SSP America announces the opening of Hard Rock Cafe at Tampa International Airport

LONDON, 2016-Aug-26 — /EPR Retail News/ — SSP America, a division of SSP Group, a leading operator of food and beverage brands in travel locations worldwide, announced today (25-August-2016) the opening of Hard Rock Cafe at Tampa International Airport. The first Hard Rock Cafe to open in a North American airport, the restaurant’s iconic music memorabilia pieces and immersive dining experience will set an entertaining stage for TPA guests.

“The Hard Rock name really brings that ‘wow’ factor to our Main Terminal,” said Tampa International Airport CEO Joe Lopano. “Having North America’s first airport Hard Rock Cafe puts us on an international map and will draw visitors from all over the world for many years to come.”

The TPA Hard Rock Cafe is operated by SSP America and features authentic memorabilia from new and legendary music icons, including pieces from Prince, Lady Gaga and Les Paul. The new Hard Rock Cafe will also feature a Rock Shop retail store, selling Tampa International Airport Hard Rock Cafe t-shirts, mugs, children’s clothing, pins and other merchandise branded specifically for the new airport location. The cafe celebrated its opening with Hard Rock’s traditional grand opening guitar smash, joined by a DJ and rock ‘n’ roll star impersonators.

“Our exclusive partnership with Florida’s own Hard Rock Cafe has made the opportunity to bring the very first iconic rock and roll restaurant to an airport possible,” said John Clark, Vice President, Business Development of SSP America. “We’re so glad this world-renowned brand has opened at Tampa International Airport because it’s but one indication of our larger commitment to the airport’s vision of remaining a major driver for economic growth in the region.”

“Of course, none of this would be possible without the help of our amazing local Tampa partners Bob Coyne, Ruben Perez, Carlos Alfonso and Drew Weatherford,” Clark said. “At SSP America, we have a passion for the passenger experience, and there is no experience quite like a Hard Rock Cafe.  With a vibrant energy, delicious food, custom cocktails and renowned Rock Shop, we’re confident TPA passengers will love Hard Rock Cafe!”

Hard Rock is one of the most globally recognized brands, with cafes and other venues all over the world. The first Hard Rock Cafe opened in London in 1971 – coincidentally the same year the newly constructed Tampa International Airport opened. Guests of Hard Rock can also enjoy authentic, American fare from the brand’s scratch-based menu, as well as a wide-variety of innovative cocktails.

“Hard Rock has been looking forward to opening another cafe after more than five successful years of operating in Tampa, and we could not have asked for a more dynamic and exciting location than the Tampa International Airport,” said Calum MacPherson, Area Vice President of Cafe Operations (North America – East) for Hard Rock International. “We look forward to becoming a must-see destination for both travelers and locals alike as we join this energetic community.”

SSP America and Hard Rock will celebrate the opening with a ceremonial “guitar smash,” where executives and local dignitaries will “smash” defective, non-playable guitars. In return, SSP America and Hard Rock will donate 10 new guitars to the Tampa Chapter of Guitars for Vets, a national organization that supports war Veterans suffering from Post Traumatic Stress Disorder (PTSD).

If you are a journalist and have a press enquiry, please call:
Templemere Public Relations
+44 (0) 1306 735574
press.office@ssp-intl.com

Source:  SSP America

DIE MIGROS HITZKIRCH STARTET FRISCH

Dierikon, 2016-Aug-26 — /EPR Retail News/ — Am 1. September 2016 öffnet in Hitzkirch, an der Hauptstrasse zwischen Gelfingen und Ermensee, die neue Migros-Filiale. Sie bietet ein breites Angebot für den täglichen Bedarf.

Auf rund 700m2 präsentiert die Migros Hitzkirch ein attraktives Sortiment an Lebensmitteln für den täglichen Bedarf, Frischprodukten, Non Food-Artikeln und einem Aussenverkauf mit Garten- und Pflanzensortiment. Sämtliche Artikel werden in Selbstbedienung angeboten. Die Migros Hitzkirch ist die 49. Migros-Filiale in der Zentralschweiz und liegt im Erdgeschoss der Wohn- und Geschäftsliegenschaft Richensee 2. Insgesamt investiert die Migros Luzern rund 2.2 Mio. Franken in den Ausbau der Filiale.

Filiale steht für Regionalität und Nachhaltigkeit

12 Mitarbeitende, die meisten aus dem Seetal, werden die Migros-Filiale betreiben. Mit Roland Häfliger, bisher Filialleiter der Migros Grabenstrasse in Zug, übernimmt ein erfahrener Detailhändler das Zepter und die Leitung eines motivierten Teams. Die Migros legt, ganz im Sinn von Generation M, bei ihren Filialen Wert auf Nachhaltigkeit, so auch in Hitzkirch. Das gesamte Gebäude entspricht dem Minergie-Standard. Die Innenausstattung ist mit LED-Leuchten sowie Kühlmöbeln mit energieeffizienten Glastüren ausgestattet.

Knackige Aktivitäten und Eröffnungsrabatt

Von Donnerstag, 1. bis Samstag, 3. September wird die Eröffnung der Migros Hitzkirch gefeiert. Mit dem Eröffnungsmotto rund um den Apfel nimmt sie Bezug zur Hochstammregion Seetal. Während den drei Eröffnungstagen erhalten die Kunden 10% Eröffnungs-Rabatt auf das gesamte Sortiment. Zusätzlich können Kunden attraktive Preise gewinnen: Hinter einzelnen Äpfeln an einer Spielwand verbergen sich Einkaufsgutscheine oder Naturalpreise im Gesamtwert von 6‘000 Franken. Die ersten 1‘500 Kunden erhalten als Willkommensgeschenk einen praktischen Sparschäler, die kleinen Besucher einen Ballon. Und für die besondere Frische sorgen zwei Degustationen: am Donnerstag 1. September können die Äpfel des „Aus der Region. Für die Region.”-Produzenten Markus Thali aus Gelfingen verkostet werden, am Freitag 2. September die Sprossen von Heinz Schmid aus Gelfingen.

Öffnungszeiten Migros Hitzkirch:

Montag-Donnerstag 8.00 Uhr bis 18.30 Uhr

Freitag 8.00 Uhr bis 20.00 Uhr

Samstag 8.00 Uhr bis 16.00 Uhr

Adresse:

Migros Hitzkirch, Richensee 2, 6285 Hitzkirch

Contact:

Genossenschaft Migros Luzern
Rahel Kissel-Probst
Unternehmenskommunikation
Industriestrasse 2
6036 Dierikon
tel:041 455 73 49
rahel.kissel@migrosluzern.ch

Source: Migros

Starbucks Corporation to present at the Goldman Sachs 23rd Annual Global Retailing Conference on September 7, 2016

Starbucks Corporation to present at the Goldman Sachs 23rd Annual Global Retailing Conference on September 7, 2016


Seattle, 2016-Aug-26 — /EPR Retail News/ — Starbucks Corporation (NASDAQ: SBUX) today (August 24, 2016) announced the company will present at the Goldman Sachs 23rd Annual Global Retailing Conference on Wednesday, September 7, 2016 at 3:55 p.m. ET.

The presentation will be webcast and can be accessed at http://investor.starbucks.com. A replay of the webcast will be available at the same URL until October 7, 2016.

About Starbucks
Since 1971, Starbucks Coffee Company has been committed to ethically sourcing and roasting high-quality arabica coffee. Today, with more than 24,000 stores around the globe, Starbucks is the premier roaster and retailer of specialty coffee in the world. Through our unwavering commitment to excellence and our guiding principles, we bring the unique Starbucks Experience to life for every customer through every cup. To share in the experience, please visit our stores or online at news.starbucks.com and Starbucks.com.

Media contact:

Global
Phone: 206 318 7100
Email: press@starbucks.com

Source: Starbucks

###

Carrefour Poland opens its second “Gourmet” Market supermarket

Carrefour Poland opens its second “Gourmet” Market supermarket


POLAND, 2016-Aug-26 — /EPR Retail News/ — Carrefour Poland opened its second “Gourmet” Market supermarket. The store, located in Podkowa Leśna (near Warsaw) and extending over some 1,100 square metres, provides its customers with a broad, diversified offering of over 15,000 products and a series of solutions aimed at improving customer satisfaction with product and service offerings and customer service quality.

The new supermarket in the Podkowa shopping centre at 26 rue Gołębia in Podkowa Leśna offers its customers a modern, spacious sales area of about 1,100 m².

The new Podkowa Leśna store has an extremely varied offering. Consisting of over 15,000 different products, it includes a vast choice of fruit and vegetables, regional products supplied by local manufacturers and farmers, traditional cured meats from the “Wędzarnia Carrefour” smokery and an assortment of “health” products (a range for diabetics and organic, gluten-free, lactose-free, soya-based and low-fat products). The range of healthy products is supplemented by products sold in bulk such as raisins, nuts, beans, peas and lentils. The new store also stocks products from the Carrefour Quality Line range, regional products of French origin under the “Reflets de France” brand and Italian “Terre d’Italia” specialities, marketed exclusively by Carrefour.

Customers of the new store can also take advantage of programmes to help them save whilst shopping: „Karty Dużej Rodziny” (large family card) and „Karty Seniora”, and can take part in the „Zyskuj na okrągło” (Benefit round the clock) campaign, which enables customers to buy basic necessities at stable, “square deal” prices.

This Carrefour store is the first supermarket to open in the town of Podkowa Leśna. It employs 45 people, mainly from Podkowa Leśna and the surrounding area.

For all request about the Carrefour Group (sales, financial results, governance, international,…), please contact the Carrefour Group media relations office:

. By phone:

Switchboard: +33 (0)1 41 04 26 00

For journalists: +33 (0)1 41 04 26 17

. By e-mail: presse_groupe@carrefour.com

Source: Carrefour

###

Sears Holdings Corporation announces 2Q financial results ended July 30, 2016

HOFFMAN ESTATES, Ill., 2016-Aug-26 — /EPR Retail News/ — Sears Holdings Corporation (“Holdings,” “we,” “us,” “our,” or the “Company”)(NASDAQ: SHLD) today (Aug 25, 2016) announced financial results for its second quarter ended July 30, 2016. As a supplement to this announcement, a presentation, pre-recorded conference and audio webcast are available at our website http://searsholdings.com/invest.

In summary, we reported:

  • Net loss attributable to Holdings’ shareholders of $395 million ($3.70 loss per diluted share) for the second quarter of 2016 compared to net income attributable to Holdings’ shareholders of $208 million ($1.84 per diluted share) for the prior year second quarter;
  • Adjusted for significant items, we would have reported a net loss attributable to Holdings’ shareholders of $217 million ($2.03 loss per diluted share) for the second quarter of 2016 compared to a net loss attributable to Holdings’ shareholders of $256 million ($2.40 loss per diluted share) in the prior year second quarter;
  • Adjusted EBITDA of $(191) million in the second quarter of 2016, improved from $(226) million in the prior year second quarter;
  • Kmart and Sears Domestic comparable store sales declined 3.3% and 7.0%, respectively, in the second quarter of 2016;
  • During the second quarter of 2016, the Company generated cash proceeds of $176 million from the sale of real estate properties and other asset sales; and
  • We received an offer from ESL Investments, Inc. (“the ESL proposal”) to provide $300 million of additional debt financing secured by a junior lien against our inventory, receivables and other working capital, which offer has been accepted.

Edward S. Lampert, Holdings’ Chairman and Chief Executive Officer, said, “We continue to face a challenging competitive environment and while we continue to focus on our overall profitability, including managing expenses, we reported a net loss for the second quarter. We are encouraged by the year-over-year improvement in our Adjusted EBITDA and feel we are making progress in our transformation as we remain focused on our best stores, our best members and our best categories to drive our business and enhance the member experience.”

Rob Schriesheim, Holdings’ Chief Financial Officer, said, “During the first half of 2016, we have demonstrated our ability to finance our transformation strategy with the levers available to us through our portfolio of assets and businesses. The sale of assets, combined with the previous closing of the $750 million Term Loan, together with the $500 million Secured Loan Facility, provided us with over $1.4 billion of financing during the first half of 2016. We have continued to demonstrate our flexibility in the third quarter of 2016 with the announcement of the recently received offer to provide $300 million of additional debt financing. As we move into the second half of 2016, we continue to explore alternatives for our Kenmore®, Craftsman® and DieHard® and Sears Home Services businesses by evaluating potential partnerships or other transactions. As we navigate through the current challenging retail environment and executing our transformation, we will continue to take actions to adjust our capital structure and manage our business to enable us to execute on our transformation while meeting all of our financial obligations.”

Financial Results

Revenues decreased approximately $548 million to $5.7 billion for the quarter ended July 30, 2016, compared to revenues of $6.2 billion for the quarter ended August 1, 2015. The decrease in revenue was primarily driven by a 5.2% decline in comparable store sales during the quarter, which accounted for $240 million of the revenue decline, and by having fewer Kmart and Sears Full-line stores in operation, which accounted for $199 millionof the decline. In addition, we also experienced a decline in revenues from Sears Hometown and Outlet Stores, Inc. of approximately $75 million during the second quarter of 2016.

At Kmart, comparable store sales decreased 3.3%. We experienced comparable store sales increases in several categories this quarter, including toys, jewelry, mattresses and apparel, which were more than offset by declines in the pharmacy, grocery & household and consumer electronics categories. Sears Domestic comparable store sales decreased 7.0%, primarily driven by decreases in home appliances, apparel, consumer electronics, footwear, lawn & garden and tools.

During the quarter, gross margin decreased $175 million due to the above noted decline in sales, as well as a decline in our gross margin rate. As a result of the Seritage and JV transactions, the second quarter of 2016 included additional rent expense of approximately $48 million and the second quarter of 2015 included additional rent expense and assigned sub-tenant rental income of approximately $26 million.

Kmart’s gross margin rate for the second quarter improved 10 basis points compared to the prior year second quarter, while Sears Domestic’s gross margin rate declined 150 basis points. Excluding the impact of significant items noted in our Adjusted Earnings Per Share tables, Kmart’s gross margin rate would have declined 10 basis points, while Sears Domestic’s gross margin rate would have declined 100 basis points compared to the prior year second quarter. While we experienced improvement in several categories in our Kmart format, the overall decline in Kmart’s gross margin rate was primarily due to declines in the grocery & household and apparel categories. The decline in Sears Domestic’s gross margin rate was primarily driven by a decline in the apparel category. The margin rate in both segments was negatively impacted by increased promotional markdowns, including an increase in Shop Your Way® expense.

Selling and administrative expenses decreased $210 million in the second quarter of 2016 compared to the prior year quarter. Excluding significant items noted in our Adjusted Earnings Per Share tables, selling and administrative expenses declined $193 million primarily due to a decrease in payroll expense. In addition, advertising expense declined as we shifted away from traditional advertising to the use of Shop Your Way® points expense, which is included within gross margin.

Our effective tax rate for the second quarter of 2016 was an expense of 3.4%. The application of the requirements for accounting for income taxes in interim periods, after consideration of our valuation allowance, causes a significant variation in the typical relationship between income tax expense and pretax income. During the prior year quarter, the Company realized a significant tax benefit on the deferred taxes related to indefinite-life assets associated with the properties sold in the transaction with Seritage. As such, our effective tax rate for the second quarter of 2015 was a benefit of 1,700.0%.

The Company reported a net loss attributable to Holdings’ shareholders of $395 million for the second quarter of 2016 compared to net income attributable to Holdings’ shareholders of $208 million for the prior year period. Net loss attributable to Holdings’ shareholders for the second quarter of 2016 and net income attributable to Holdings’ shareholders for the second quarter of 2015 included significant items noted in our Adjusted Earnings Per Share tables, which aggregated to expense of $178 million and income of $464 million, respectively. Adjusting for these significant items, we would have reported a net loss attributable to Holdings’ shareholders of $217 million and $256 million in the second quarter of 2016 and 2015, respectively.

Financial Position

The Company’s cash balances were $276 million at July 30, 2016 compared with $238 million at January 30, 2016. Short-term borrowings totaled$164 million at the end of the second quarter of 2016 compared to $797 million at January 30, 2016.

Merchandise inventories were $4.7 billion at July 30, 2016, compared to $5.0 billion at August 1, 2015, while merchandise payables were $1.3 billion and $1.7 billion at July 30, 2016 and August 1, 2015, respectively.

At July 30, 2016, we had utilized approximately $719 million of our $1.971 billion revolving credit facility due in 2020 (consisting of $63 million of borrowings and $656 million of letters of credit outstanding). The amount available to borrow under our credit facility was approximately $191 million, which reflects the effect of our springing fixed charge coverage ratio covenant and the borrowing base limitation in our revolving credit facility, which varies primarily based on our overall inventory and receivables balances. Under the credit facility agreement, the fixed charge coverage ratio changed in August 2016, which increases our availability to borrow under the credit agreement by approximately $175 million.

Total long-term debt (including current portion of long-term debt and capital lease obligations) was $3.4 billion and $2.2 billion at July 30, 2016 and January 30, 2016, respectively.

In August 2016, we received the ESL proposal to provide $300 million of additional debt financing secured by a junior lien against our inventory, receivables and other working capital, which offer has been accepted. Under the ESL proposal, the Company may, in its discretion, offer to third party investors the right to participate in up to an additional $200 million of debt financing on the same terms and conditions. The financing is subject to customary conditions and is expected to close in the next 7 to 10 business days. The terms of the debt financing were approved by the Related Party Transactions Subcommittee of the Board of Directors of the Company, with advice from Centerview Partners and Weil Gotshal & Manges, the Subcommittee’s outside financial and legal advisors.

Update on Strategic Initiatives

On May 26, 2016, we announced our intention to explore alternatives for our Kenmore®, Craftsman® and DieHard® brands and our Sears Home Services business by evaluating potential partnerships or other transactions that could expand distribution of our brands and service offerings to realize significant growth. We initiated a formal process and have received interest from a variety of potential partners, both domestic and international, and including retailers, original equipment manufacturers, financial investors and others. Citigroup Global Markets and LionTree Advisors are assisting us in these efforts as we continue our assessment over the next few months. There can be no assurance that we will complete one or more transactions, but we intend to aggressively evaluate all of the potential alternatives available to these businesses.

Adjusted EBITDA

In addition to our net income (loss) attributable to Sears Holdings’ shareholders determined in accordance with Generally Accepted Accounting Principles (“GAAP”), for purposes of evaluating operating performance, we use Adjusted Earnings Before Interest, Taxes, Depreciation and Amortization (“Adjusted EBITDA”) and Adjusted Earnings Per Share (“Adjusted EPS”), which are non-GAAP measures. The tables attached to this press release provide a reconciliation of GAAP to as adjusted amounts. We believe that our use of Adjusted EBITDA and Adjusted EPS provides an appropriate measure for investors to use in assessing our performance across periods, given that these measures provide adjustments for certain significant items which may vary significantly from period to period, improving the comparability of year-to-year results and is therefore representative of our ongoing performance. Therefore, we have adjusted our results for them to make our statements more useful and comparable. However, we do not, and do not recommend that you, solely use Adjusted EBITDA or Adjusted EPS to assess our financial and earnings performance. We also use, and recommend that you use, diluted earnings (loss) per share in addition to Adjusted EPS in assessing our earnings performance.

As a result of the Seritage and JV transactions, Adjusted EBITDA for the second quarter of 2016 and 2015 included additional rent expense of approximately $48 million and $26 million, respectively, while the first half of 2016 and 2015 included additional rent expense of approximately $102 million and $26 million, respectively. Due to the structure of the leases, we expect that our cash rent obligations to Seritage and the joint venture partners will decline, over time, as space in these stores is recaptured. From the inception of Seritage to date, we have received recapture notices on 15 properties, which is estimated to reduce the rent expense by approximately $8 million on an annual basis.

Forward-Looking Statements

Results are unaudited. This press release contains forward-looking statements intended to qualify for the safe harbor from liability established by the Private Securities Litigation Reform Act of 1995, including, but not limited to, statements about our transformation through our integrated retail strategy, our plans to redeploy and reconfigure our assets, our liquidity, including our expectation to close the $300 million of additional debt financing from ESL Investments Inc., our ability to exercise financial flexibility as we meet our obligations and pursue possible strategic transactions, our intention to explore potential partnerships or other transactions involving our Kenmore®, Craftsman® and DieHard® brands and our Sears Home Services business, and other statements that describe the Company’s plans. Whenever used, words such as “will,” “expect,” and other terms of similar meaning are intended to identify such forward-looking statements. Forward-looking statements, including these, are based on the current beliefs and expectations of our management and are subject to significant risks, assumptions and uncertainties, many of which are beyond the Company’s control, that may cause our actual results, performance or achievements to be materially different from any future results, performance or achievements expressed or implied by these forward-looking statements. Detailed descriptions of risks, uncertainties and factors relating to Sears Holdings are discussed in our most recent Annual Report on Form 10-K and other filings with the Securities and Exchange Commission. While we believe that our forecasts and assumptions are reasonable, we caution that actual results may differ materially. We intend the forward-looking statements to speak only as of the time made and do not undertake to update or revise them as more information becomes available, except as required by law.

Pre-Recorded Conference Call and Audio Webcast

Sears Holdings, in conjunction with today’s financial results announcement, will simultaneously post a pre-recorded conference call and audio webcast on its corporate website. It will feature prepared remarks from Robert A. Schriesheim, executive vice president and chief financial officer, who will focus his comments to provide additional context around the quarter. The pre-recorded conference call may be accessed by telephone at 844.826.0613 or 973.200.3092 (conference ID: 67300953), and on Sears Holdings’ website at http://www.searsholdings.com/invest/ under “Events & Presentations.” The accompanying presentation and transcript will be posted online in conjunction.

About Sears Holdings Corporation

Sears Holdings Corporation (NASDAQ: SHLD) is a leading integrated retailer focused on seamlessly connecting the digital and physical shopping experiences to serve our members – wherever, whenever and however they want to shop. Sears Holdings is home to Shop Your Way®, a social shopping platform offering members rewards for shopping at Sears and Kmart, as well as with other retail partners across categories important to them. The Company operates through its subsidiaries, including Sears, Roebuck and Co. and Kmart Corporation, with full-line and specialty retail stores across the United States. For more information, visit www.searsholdings.com.

MEDIA CONTACT:
Sears Holdings Public Relations
(847) 286-8371

Source: Sears Holdings Corporation

Argos opens new digital store inside Sainsbury’s supermarket on London Road, Stoke- on-Trent

Milton Keynes, UK, 2016-Aug-26 — /EPR Retail News/ — A brand new Argos digital store opened today (24/08/2016) inside the Sainsbury’s supermarket on London Road, Stoke- on-Trent bringing extra choice and convenience to customers in the area.

The new digital store has created 20 local jobs and follows the success of the 10 stores opened within Sainsbury’s supermarkets during 2015.

The smaller, new format Argos store offers the most popular products that customers want for immediate pick up with c.20,000 products available for store collection within a few hours ranging from toys to tablets to tables.

Peter Jones, Manager of the Sainsbury’s store, said: “We’re very pleased to welcome the Argos team to our store, and we are looking forward to feedback from customers about the increased range and offer. It’s a great, complementary product offer and provides the convenience that our customers are looking for. We’re also enjoying getting to know the Argos team and welcoming them into store as we work together to serve customers.”

Steve Rowlands, Argos Store Manager, added: “Over the last few weeks passers-by have been trying to get a sneak peek of the store, and they’ve all said “wow.” It’s a really convenient addition for local shoppers and will allow them to have access to an extended range of non-food items.”

The new store is equipped for shopping in the digital age, with tablets that mirror the online shopping experience and staff on hand to help. Around half of Argos’ total sales now start online, but 80% of customers will visit one of 842 stores to pick up their goods.

Notes to Editors

Photographs of the Argos store in a Sainsbury’s are available from the Argos Press Office on 0845 120 4365 or email media.relations@argos.co.uk

Argos now offers same day delivery and faster in-store collection with Fast Track.

You can now buy online and get your order delivered the same day for £3.95, seven days a week, with Fast Track Delivery. You can also buy online and collect from our dedicated Fast Track counters in-store in as little as 60 seconds.

About Argos
Argos is a leading UK digital retailer, offering around 60,000 products through www.argos.co.uk, its growing mobile channels, stores and over the telephone.

Argos continues to be the UK’s largest high street retailer online with around 120m customer transactions a year through its stores and over 975 million website and app visits in the 12 months to February 2016.  Customers can take advantage of Argos’ convenient Check & Reserve service available through its network of 842 stores and concessions across the UK and Republic of Ireland.

In the financial year to February 2016, Argos sales were £4.1 billion and it employed some 30,000 people across the business.

Argos is part of Home Retail Group, the UK’s leading home and general merchandise retailer.

About Sainsbury’s
Founded in 1869, Sainsbury’s today operates over 1,200 stores, employing around 161,000 colleagues across the UK.

With 24 million customer transactions every week, the company’s focus is on delivering high quality, affordable food, clothing and general merchandise across supermarkets, convenience stores and online.

Sainsbury’s Bank offers accessible financial products that reward customers who both bank and shop with Sainsbury’s. Strong, well-established values are integral to Sainsbury’s success in helping customers Live Well for Less.

For more information about Sainsbury’s, please contact the Sainsbury’s press office on 020 7695 7295 or email press_office@sainsburys.co.uk

###

Argos opens new digital store inside Sainsbury’s supermarket on London Road, Stoke- on-Trent


Source: Argos

John Lewis to hire over 3,500 temporary Partners ahead of the busiest shopping period of the year

London, 2016-Aug-26 — /EPR Retail News/ — John Lewis is searching for over 3,500 temporary Partners (staff) to fill roles across the retail and distribution arms of its business, ahead of the busiest shopping period of the year.

The retailer is recruiting new Partners to assist customers in preparing for the festive season, with positions available across a number of departments including the John Lewis Christmas Shop, electrical and home technology, gift food and catering, as well as behind-the-scenes stock management roles.

In addition to branch roles, John Lewis also has vacancies available across its distribution and contact centres networks to support branches and johnlewis.com.

Charlotte Veillet, resourcing manager at John Lewis said: ‘Temporary Partners help to make Christmas at John Lewis! We’re looking for bright, happy and hardworking individuals to add the Christmas sparkle to our customers’ shopping experience. From expertly gift-wrapping the perfect present, to ensuring stock levels are as good as they can be or supporting our behind-the-scenes operations at one of our distribution or contact centres, we’re excited to welcome new team members to create an unbeatable Christmas shopping experience for our customers.’

The John Lewis recruitment team is committed to training all Christmas temporary staff to achieve the highest level of customer service, in order to ensure our customers receive excellent customer service with every shopping experience.

Dino Rocos, Operations Director at John Lewis, is an example of how far a temporary Christmas role can take you. Having joined the business in 1976 as a temporary Partner, Dino now sits on the business’s management board and heads up its entire logistics operation.

Dino Rocos, Operations Director said: ‘I certainly didn’t think when I joined John Lewis as a Christmas temp that I would still be here forty years later as a board director.  The business provided me with the support to help develop my skills and knowledge from the very beginning and it quickly became clear to me that I was developing a fascination for retail, so accepting an offer for a permanent job at the end of my contract was an easy decision.

‘As time progressed I began to understand more about the organisation and its focus on fairness – this was something that was very attractive to me, and something that I’ve carried forward into my leadership style in my current role as Operations Director. A temporary Christmas role was the ideal foot in the door for me and I’d urge anyone with an interest in retail to consider applying this year.’

Those interested in applying should visit www.jlpjobs.com, where batches of vacancies will be advertised between now and September.

Notes to editors

John Lewis – John Lewis operates 46 John Lewis shops across the UK (32 department stores, 12 John Lewis at home and shops at St Pancras International and Heathrow Terminal 2) as well as johnlewis.com. It is part of the John Lewis Partnership, the UK’s largest example of worker co-ownership and all 30,000 John Lewis staff are Partners in the business.

John Lewis stocks more than 350,000 separate lines in its department stores and johnlewis.com across fashion, home and technology, and was named  ‘Best In-Store Experience’, ‘Best Clothing Retailer,’ ‘Best Electricals Retailer,’ ‘Best Furniture Retailer,’ ‘Best Homewares Retailer’ and ‘Best Click & Collect Retailer’ in the 2016 Verdict Customer Satisfaction awards.

Johnlewis.com is consistently ranked one of the top online shopping destinations in the UK. John Lewis Insurance offers a range of comprehensive insurance products – home, car, wedding and event, travel and pet insurance and life cover – delivering the values of expertise, trust and customer service expected from the John Lewis brand.

You can follow John Lewis on the following social media channels:
www.johnlewis.com/twitter
www.johnlewis.com/facebook
www.johnlewis.com/youtube.

General enquires
For further information please contact:

Emma Cole
Communications Officer, Corporate
Telephone: 0207 798 3829
Email: emma.cole@johnlewis.co.uk

Source: John Lewis

Fendi celebrates its 90th anniversary with an exhibition entitled “FENDI Roma – The Artisans of Dreams”

Fendi celebrates its 90th anniversary with an exhibition entitled “FENDI Roma – The Artisans of Dreams”


Paris, 2016-Aug-26 — /EPR Retail News/ — In conjunction with Fendi’s 90th anniversary, the Italian house is celebrating nine decades of passion, creativity and savoir-faire with an exhibition entitled “FENDI Roma – The Artisans of Dreams”. The Palazzo della Civiltà Italiana provides a stunning venue for the event.

Fendi is celebrating its 90th anniversary in grand style, including a breathtaking fashion show against the magical backdrop of the Trevi Fountain. The Italian house has also conceived a captivating exhibition, “FENDI Roma – The Artisans of Dreams”, at the Palazzo della Civiltà Italiana, Fendi’s new headquarters. The exhibition celebrates the unique craftsmanship and creativity that have informed Fendi’s DNA since its beginnings.

The installations illustrate the dual perspective and complementary fit between heritage and innovation, values that define the artisanal craftsmanship that Fendi has meticulously perpetuated. A poetic and sensual tour takes visitors into nine worlds that reveal Fendi’s heritage and history in Rome. Video, tactile interaction and audio combine for a multi-sensory experience, replete with optical illusions for a total immersion into the universe of the Italian house.

Visitors discover the Obsession installation, a psychedelic furry jungle inhabited by over three hundred furry little Bag Bugs imagined by Silvia Venturini Fendi, a third generation member of the Fendi family and creative director for Fendi Accessories, Menswear and Childrenswear. TheCraftsmanship part of the exhibition features an entirely different ambiance where a stimulating visual and graphic atmosphere presents the work of artisans, including live demonstrations. There is also an exhibition of drawings and sketches by Karl Lagerfeld, creative director of Fendi since 1965. A host of other surprises await visitors at this memorable exhibition, which is open until October 29, 2016.

Practical information:
Open Monday to Saturday, 10 am to 8 pm until October 29, 2016.
Palazzo della Civiltà Italiana, Quadrato della Concordia, 3 – Rome

Contact:

LVMH Moët Hennessy – Louis Vuitton
22, avenue Montaigne, 75008 Paris – France
Tel: +33 (0)1 44 13 22 22
Fax: +33 (0)1 44 13 22 23

Source: LVMH

###

The Michaels Companies announced 2Q financial results ended July 30, 2016

IRVING, Texas, 2016-Aug-26 — /EPR Retail News/ — The Michaels Companies, Inc. (NASDAQ:MIK) today (Aug. 25, 2016) announced financial results for the second quarter ended July 30, 2016.

“We are pleased that our team delivered second quarter results within our expectations, despite a retail environment which continues to be choppy. As anticipated, the quarter was uniquely challenged by the impact of investments we are making to support our Vision 2020 strategy, including the integration of Lamrite West and initiatives to reduce long-term product acquisition costs, as well as the unfavorable timing of distribution expenses,” said Chuck Rubin, Chairman and Chief Executive Officer. “As we move into the second half of the year and into fiscal 2017, we expect to see the benefits of our strategic investments on sales and profitability.”

Second Quarter Highlights

  • Net sales increased 7.7%, or 8.1% on a constant currency basis, to $1,060.4 million , from $984.3 million in the second quarter of fiscal 2015.  The increase was primarily a result of the acquisition of Lamrite West in February 2016 and sales from 17 additional stores (net of closures) during the quarter.  Comparable store sales increased 0.7%, or 1.0% on a constant currency basis, driven by an increase in customer transactions.
  • Gross profit increased 4.7% to $390.7 million, from $373.3 million in the second quarter of fiscal 2015.  As a percentage of net sales, gross profit was 36.8% compared to 37.9% in the second quarter of fiscal 2015. The decrease, as a percentage of net sales, was due to the acquisition of Lamrite West, including the impact of Lamrite West’s wholesale business, which has a lower gross margin rate than the Michaels business; the timing of distribution expenses; a higher mix of sales from merchandise sold on promotion; and the timing of profit recognition for the product Michaels buys through Lamrite West.  The decrease was partially offset by improved sourcing and pricing efficiencies and $1.4 million of net non-recurring, inventory-related purchase accounting adjustments related to the acquisition of Lamrite West.
  • Selling, general and administrative expense, including store pre-opening costs, (“SG&A”) increased 9.7% to $303.6 million, from $276.7 million in the second quarter of fiscal 2015. As a percent of net sales, SG&A was 28.6%, compared to 28.1% in the second quarter of fiscal 2015. The increase in SG&A was primarily due to $17.4 millionassociated with the acquisition of Lamrite West, including: $1.9 million of integration expenses; expenses associated with operating 17 additional stores (net of closures); an unplanned credit card assessment of $2.9 million; and higher professional fees.  The increase was partially offset by lower in-store signage expense.
  • Operating income was $87.1 million, compared to $96.6 million in the second quarter of fiscal 2015.  As a percent of net sales, operating income was 8.2% compared to 9.8% in the second quarter of fiscal 2015.
  • Interest expense decreased $2.4 million to $32.0 million, from $34.3 million in the second quarter of fiscal 2015 due to a voluntary principal payment of $150.0 million on the Restated Term Loan Credit Facility in the fourth quarter of fiscal 2015 and interest savings from the refinancing of the Restated Revolving Credit Facility.  The Company recorded a loss on the early extinguishment of debt of $0.4 million during the second quarter of fiscal 2016 related to the refinancing of the Restated Revolving Credit Facility in May 2016. The Company recorded a loss on the early extinguishment of debt of $6.1 million during the second quarter of fiscal 2015 related to the redemption of the PIK Notes in May 2015.
  • The effective tax rate was 35.5% for the second quarter of fiscal 2016, compared to 36.6% for the second quarter of fiscal 2015.
  • Net income was $35.6 million, compared to $35.7 million in the second quarter of fiscal 2015. Diluted earnings per common share was $0.17, compared to $0.17 in the second quarter of fiscal 2015.
  • During the second quarter of fiscal 2016, the Company opened five new Michaels stores and two new Pat Catan’s stores and closed three Aaron Brothers stores, compared with nine new Michaels store openings in the second quarter of 2015. At the end of the second quarter, the Company operated 1,209 Michaels stores, 112 Aaron Brothers stores, and 35 Pat Catan’s stores.
  • The Company ended the second quarter of fiscal 2016 with $114.8 million in cash, $2.8 billion in debt and $597.1 million in availability under its asset-based revolving credit facility.
  • Inventory at the end of the second quarter increased $71.7 million, or 6.7%, to $1,145.4 million, compared to $1,073.7 million in the second quarter of fiscal 2015.  The increase in inventory was due to $96.2 million in additional inventory from the acquisition of Lamrite West.  Average Michaels inventory on a per store basis, inclusive of distribution centers, in transit and inventory for the Company’s e-commerce site, decreased 3.9% to $846,000, compared to $880,000 at the end of the second quarter of fiscal 2015.  This decrease in inventory per store was primarily a result of higher inventory in fiscal 2015 resulting from the early receipt of seasonal merchandise in an effort to mitigate the impact of West Coast port issues in early 2015.
  • During the quarter, the Company purchased 2.4 million shares, or $67.6 million, under its share repurchase authorization. The total remaining authorization for future repurchases is approximately $73.1 million.  The share repurchase program does not have an expiration date, and the timing and number of repurchase transactions under the program will depend on market conditions, corporate considerations, debt agreements, and regulatory requirements.

Third Quarter and Fiscal Year 2016 Outlook:

Commenting on expectations for the rest of fiscal 2016, Mr. Rubin said, “Although sales growth in the first half of fiscal 2016 was more challenging than we anticipated, we believe that we continue to gain market share. We are excited about our plans to engage customers and drive traffic into our stores in the second half. However, we believe it is prudent to be conservative with our comparable store sales expectations for the rest of fiscal 2016 to reflect a continuation of the current retail environment. Our team continues to manage the business well against this backdrop, and we remain confident that the investments we are making, including our sourcing initiatives and our tax planning efforts related to the acquisition of Lamrite West, will help drive double-digit earnings growth for the year.”

For fiscal 2016, the Company expects:

  • Comparable store sales to increase 1.0% to 1.5%;
  • Total net sales growth, including revenues from Lamrite West, of 6.8% to 7.8%;
  • Approximately 1.3% sales growth from 23 net new store openings, including 3 new Pat Catan’s stores;
  • Lamrite West to generate $225 million to $250 million in revenues;
  • Adjusted operating income to be in the range of $750 million to $770 million, excluding approximately $14 million to $15 million of integration costs and net non-recurring, inventory-related purchase accounting entries;
  • Annual interest expense to be approximately $129 million;
  • The effective tax rate to be approximately 35.4%;
  • Adjusted diluted earnings per common share to be between $1.92 and $1.98, based on diluted weighted average common shares of approximately 207 million; and
  • Capital expenditures of between $125 million and $135 million.

For the third quarter of fiscal 2016, the Company expects:

  • Comparable store sales growth of 0.5% to 1.5%;
  • Approximately 13 net new store openings;
  • Adjusted operating income of $160 million to $165 million;
  • Interest expense to be approximately $32 million;
  • The effective tax rate to be approximately 31.4%; and
  • Adjusted diluted earnings per common share of $0.42 to $0.44, based on diluted weighted average common shares of 206 million.

The outlook for fiscal 2016 includes approximately $0.01 of favorable earnings per share impact related to 2.4 million shares repurchased in the second quarter of fiscal 2016.

Conference Call Information

A conference call to discuss second quarter financial results is scheduled for today, August 25, 2016, at 8:00 am Central Time.  Analysts and investors who would like to join the conference call are encouraged to pre-register for the conference call using the following link: http://dpregister.com/10091269. Callers who pre-register will be given a conference call passcode and a unique PIN to gain immediate access to the call and bypass the live operator. Participants may pre-register at any time, including up to and after the call start time.  Investors without internet access or who are unable to pre-register can join the call by dialing (866) 777-2509 or (412)-317-5413.

The conference call will also be webcast at http://investors.michaels.com/. To listen to the live call, please go to the website at least 15 minutes before the call is scheduled to begin to register and download any necessary audio software. The webcast will be accessible for 30 days after the call.  Additionally, a telephone replay will be available untilSeptember 8, 2016, by dialing (877) 344-7529 or (412) 317-0088, access code 10091269.

Non-GAAP Information

This press release includes non-GAAP measures including Adjusted EBITDA, operating income excluding integration benefits and costs and non-recurring, inventory-related purchase accounting entries related to the acquisition of Lamrite West (“Adjusted operating income”), net income excluding integration benefits and costs and non-recurring, inventory-related purchase accounting entries related to the acquisition of Lamrite West (“Adjusted net income”), and earnings per share excluding integration benefits and costs and non-recurring, inventory-related purchase accounting entries related to the acquisition of Lamrite West (“Adjusted earnings per share”).  The Company has reconciled these non-GAAP financial measures with the most directly comparable GAAP financial measures in a table accompanying this release. The Company believes that these non-GAAP financial measures not only provide its management with comparable financial data for internal financial analysis but also provide meaningful supplemental information to investors. Specifically, these non-GAAP financial measures allow investors to better understand the performance of the Company’s business and facilitate a meaningful evaluation of its quarterly and fiscal 2016 diluted earnings per common share and actual results on a comparable basis with its quarterly and fiscal 2015 results.

In evaluating these non-GAAP financial measures, investors should be aware that in the future the Company may incur expenses or be involved in transactions that are the same as or similar to some of the adjustments in this presentation. The Company’s presentation of non-GAAP financial measures should not be construed to imply that its future results will be unaffected by any such adjustments. The Company has provided this information as a means to evaluate the results of its ongoing operations. Other companies in the Company’s industry may calculate these items differently than it does. Each of these measures is not a measure of performance under GAAP and should not be considered as a substitute for the most directly comparable financial measures prepared in accordance with GAAP. Non-GAAP financial measures have limitations as analytical tools, and investors should not consider them in isolation or as a substitute for analysis of the Company’s results as reported under GAAP.

Forward-Looking Statements

This news release includes forward-looking statements which reflect management’s current views and estimates regarding the Company’s industry, business strategy, goals and expectations concerning its market position, future operations, margins, profitability, capital expenditures, share repurchases, liquidity and capital resources, and other financial and operating information. The words “anticipate”, “assume”, “believe”, “continue”, “could”, “estimate”, “expect”, “forecast”, “future”, “guidance”, “imply”, “intend”, “may”, “outlook”, “plan”, “potential”, “predict”, “project”, and similar terms and phrases are intended to identify forward-looking statements, although not all forward-looking statements contain these identifying words. The Company cannot assure investors that future developments affecting the Company will be those that it has anticipated. Actual results may differ materially from these expectations due to risks relating to the effect of economic uncertainty, risks associated with our substantial outstanding indebtedness of $2.8 billion, changes in customer demand, risks relating to our failure to adequately maintain security and prevent unauthorized access to electronic and other confidential information, increased competition including internet-based competition from other retailers, risks relating to our reliance on foreign suppliers, risks relating to how well we manage our business, risks related to our ability to open new stores and increase comparable store sales growth, damage to the reputation of the Michaels brand or our private and exclusive brands, risks associated with executing or integrating an acquisition, a business combination or major business initiative, and other risks and uncertainties including those identified under the heading “Risk Factors” in the Company’s Form 10-K filed with the Securities and Exchange Commission(“SEC”), which is available at www.sec.gov, and other filings that the Company may make with the SEC in the future. If one or more of these risks or uncertainties materialize, or if any of the Company’s assumptions prove incorrect, the Company’s actual results may vary in material respects from those projected in these forward-looking statements. Any forward-looking statement made by the Company in this news release speaks only as of the date on which the Company makes it. Factors or events that could cause the Company’s actual results to differ may emerge from time to time, and it is not possible for the Company to predict all of them. The Company does not undertake and specifically disclaims any obligation to publicly update any forward-looking statement, whether as a result of new information, future developments or otherwise, except as may be required by any applicable securities laws.

About The Michaels Companies, Inc.:

The Michaels Companies, Inc. is North America’s largest specialty provider of arts, crafts, framing, floral, wall décor, and seasonal merchandise for the hobbyist and do-it-yourself home decorator.  As of July 30, 2016, the Company owned and operated 1,356 stores in 49 states and Canada under the brands Michaels, Aaron Brothers, and Pat Catan’s.  The Michaels Companies, Inc., also owns Artistree, a manufacturer of high quality custom and specialty framing merchandise, and Darice, a premier wholesale distributor in the craft, gift and decor industry.  The Michaels Companies, Inc. produces a number of exclusive private brands including Recollections®, Studio Decor™, Bead Landing®, Creatology®, Ashland®, Celebrate It®, Art Minds®, Artist’s Loft®, Craft Smart®, Loops & Threads®, Make Market®, Foamies®, LockerLookz®, and Sticky Sticks®. Learn more about Michaels at www.michaels.com.

Investor Contact:
Kiley F. Rawlins, CFA
972.409.7404
Kiley.Rawlins@michaels.com

ICR, Inc.
Farah Soi/Anne Rakunas
203.682.8200
Farah.Soi@icrinc.com/Anne.Rakunas@icrinc.com 

Financial Media Contact:
ICR, Inc.
Michael Fox/ Jessica Liddell
203.682.8200/ 203.682.8208
Michaels@icrinc.com

Source: Michaels Companies, Inc./GLOBE NEWSWIRE

Get your flu shot at Meijer and help fight hunger

Get your flu shot at Meijer and help fight hunger


GRAND RAPIDS, Mich., 2016-Aug-26 — /EPR Retail News/ — Meijer is encouraging customers to get flu shots early this fall by donating $5 to its signature hunger relief program, called Simply Give, for each flu shot administered at its 230 stores.

The Grand Rapids, Mich.-based retailer will donate up to $1 million to the program that stocks the shelves of its food pantry partners across the Midwest while encouraging customers to get a jump on staying healthy this flu season.

“We are excited to help our customers fight the flu this season while also fighting hunger by participating in our Simply Give program,” said Tim Lesneski, senior vice president of Drug Store, Pets & Consumables for Meijer. “There is no expiration date on receiving a flu shot, so the sooner you get your flu shot, the better chance you have of staying healthy.”

Seasonal influenza, also known as the flu, is a contagious respiratory disease that can cause mild to severe illness, and at times, lead to hospitalization or death. Every flu season is different, and influenza effects vary from person to person, which is why it’s important to understand the facts. Click here for the top Meijer flu myth busters.

From now through Nov. 26, Meijer will donate $5 to its Simply Give program for each flu shot administered. The Simply Give program has generated nearly $24 million for local food pantries since its 2008 inception.

Meijer operates 230 pharmacies in its supercenters throughout the Midwest, all of which administer the vaccine without an appointment during pharmacy hours and accept most major insurance plans. Depending on age, health status and state regulations, Meijer pharmacies offer a variety of vaccine options that include:

  • Fluvirin Trivalent: Three-strain vaccine
  • Fluzone Quadrivalent: Four-strain vaccine
  • Fluzone HD: For patients 65 and older that are typically covered by Medicare Part B

About Meijer:
Meijer is a Grand Rapids, Mich.-based retailer that operates 230 supercenters and grocery stores throughout Michigan, Ohio, Indiana, Illinois, Kentucky and Wisconsin. As a pioneer of the “one-stop shopping” concept, Meijer stores have evolved through the years to include expanded fresh produce and meat departments, as well as pharmacies, comprehensive apparel departments, garden centers and electronic offerings. For additional information on Meijer, please visit www.meijer.com. Follow Meijer on Twitter @twitter.com/meijer and @twitter.com/meijerPR or become a fan at www.facebook.com/meijer.

Contact:

Joe Hirschmugl
joseph.hirschmugl@meijer.com
616-791-3943

Source: Meijer

###

X5 announces the successful completion of stage 2 of its Forpost distribution centre in Chelyabinsk

Chelyabinsk, 2016-Aug-26 — /EPR Retail News/ — X5 Retail Group N.V. (“X5” or the “Company”), a leading Russian food retailer (LSE ticker: “FIVE”), announces the successful completion of stage 2 of its Forpost distribution centre (DC) in Chelyabinsk. With the new storage zones in operation, the DC’s total area will grow by 3.5x and reach 21,000 sq m.

The launch of stage 2 of the logistics facility, including warehouses for storing dry goods and alcoholic beverages, as well as a banana-ripening room, will boost the efficiency of X5’s supply chains and provide a logistics platform to support rapid growth of the Pyaterochka retail chain in the Urals and Siberia. The new storage zones will also encourage more local sourcing. The share of locally produced items in Pyaterochka stores across the Urals Federal District stands at an average of 30%, and reaches as much as 100% in some categories. The DC will service 642 Pyaterochkas across six regions: Chelyabinsk, Sverdlovsk, Tyumen, Kurgan Regions, Khanty-Mansi Autonomous Area (Surgut), and Bashkortostan.

Together with the Kaskad DC, already operational in Chelyabinsk, stage 2 of the Forpost DC will double the total warehousing capacity for storing dry goods. The enhanced layout design of the new dry goods warehouse seeks to accommodate six-shelf storage units, helping to reduce the number of operations and kilometers driven by warehouse trucks.

The DC can accept up to 100 vehicles daily, servicing stores up to a distance of over 400 km. With 55 warehousing trucks, the DC’s employees can handle up to 450 tonnes of goods per day.

X5 invited managers of over 70 supplier companies from the Chelyabinsk, Sverdlovsk, Tyumen, Kurgan, Orenburg and Perm regions. For suppliers, the launch of stage 2 opens up new opportunities to develop cooperation with X5’s retail chains and boost supplies to X5’s stores.

Source: X5 Retail Group N.V.

Apple Music Festival returns to London’s Roundhouse this September for a 10th anniversary celebration of live music

London, 2016-Aug-26 — /EPR Retail News/ — Apple today (August 25, 2016) announced the Apple Music Festival will return to London’s legendary Roundhouse this September for a 10th anniversary celebration of live music, curated exclusively by Apple Music for fans around the world.

The full lineup was announced today by Julie Adenuga, the London voice of Beats 1, an Apple Music radio station that celebrates the best new music every day. Apple Music lets fans get even closer to their favorite performers during the Apple Music Festival with exclusive playlists, artist news and backstage interviews throughout September. The 10 spectacular nights of live performances will be made available live and on-demand to Apple Music members in 100 countries on their iPhone, iPad, iPod touch, Mac, PC, Apple TV and Android phones.

“Over the past decade, the Festival has brought the biggest and best artists from all over the world to London and into the homes of millions of music fans,” said Oliver Schusser, Apple’s vice president of International Content. “This year’s Apple Music Festival builds on that incredible legacy and we couldn’t be more excited to have another amazing lineup to celebrate our 10th birthday.”

Artists performing at the upcoming Apple Music Festival shared their excitement:

“I love London and performing at the Roundhouse! I can’t wait to see you there. It’s going to be magic!” – Alicia Keys

“We’re massively excited to play Apple Music Festival for many reasons, but mainly because it’ll be our first proper London show after the release of our new album, Wild World. The Roundhouse is such a beautiful venue and it’s in our hometown, so I can’t think of a better place to play a bunch of new songs for the first time.” – Bastille

“I’m so excited to go back to London, which is a special place for me to visit and I’m really looking forward to performing at the Apple Music Festival. It’s also their 10th birthday! It’s going to be a great party.” – Britney Spears

“I’m very excited to be headlining at this year’s Apple Music Festival at the Roundhouse in London, and for everyone around the world to be able to watch it live on Apple Music.” – Calvin Harris

“I am so excited to be playing at the Roundhouse. I love London and can’t wait to share this fantastic experience at the Apple Music Festival with my fans.” – Elton John

“We are looking forward to returning to the iconic Roundhouse this year to play one of our favorite festivals, the Apple Music Festival, and perform new music for our fans!” – OneRepublic

“We’re really looking forward to being a part of this year’s Apple Music Festival. We loved playing at The Roundhouse for the 2013 Festival and are excited to be heading back this year.” – The 1975

Apple Music Festival runs from September 18 to September 30. Fans based in the UK can apply to win tickets by entering prize draws on Apple Music, as well as through select media partners.

Elton John: September 18
The 1975: September 19
Alicia Keys: September 20
OneRepublic: September 21
Calvin Harris: September 23
Robbie Williams: September 25
Bastille: September 26
Britney Spears: September 27
Michael Bublé: September 28
Chance the Rapper: September 30

Apple Music is a single, intuitive app that combines the best ways to enjoy music — all in one place. Over 15 million paying subscribers are already enjoying hand-picked playlists based on the music they love, hearing new music first before anyone else and discovering new artists every day.

For updates and additional information, visit applemusic.com/festival or join the conversation using #AMF10 on the official Apple Music social media channels.

Apple revolutionized personal technology with the introduction of the Macintosh in 1984. Today, Apple leads the world in innovation with iPhone, iPad, Mac, Apple Watch and Apple TV. Apple’s four software platforms — iOS, macOS, watchOS and tvOS — provide seamless experiences across all Apple devices and empower people with breakthrough services including the App Store, Apple Music, Apple Pay and iCloud. Apple’s 100,000 employees are dedicated to making the best products on earth, and to leaving the world better than we found it.

Press Contacts:

Mandy Hershon
Apple
mhershon@apple.com
+44 203 284 6194

Stephanie Saffer
Apple
ssaffer@apple.com
(408) 974-5160

Apple Media Helpline:
media.help@apple.com
(408) 974-2042

###

Apple Music Festival returns to London's Roundhouse this September for a 10th anniversary celebration of live music
Apple Music Festival returns to London’s Roundhouse this September for a 10th anniversary celebration of live music

Source: Apple

Lee’s Marketplace to acquire Day’s Market in Heber City

Lee’s Marketplace to acquire Day’s Market in Heber City


Logan, UT, 2016-Aug-26 — /EPR Retail News/ — Lee’s Marketplace is coming to Heber City. The locally owned grocer announced today (AUGUST 24, 2016) that it plans to purchase Day’s Market in Heber City and transition the store to a Lee’s Marketplace. The sale is expected to be finalized on September 26, 2016.

“We are excited to bring Lee’s to the Heber community and are looking forward to getting to know our new shoppers,” said Jonathan Badger, president of Lee’s Marketplace. “We have the deepest respect for Day’s Market and have worked with them for years as members of Associated Food Stores.”

Badger anticipates a smooth transition of the 40,000 square-foot store. Lee’s is committed to ensuring guests continue to receive excellent customer service and quality products at the Heber City store. Guests can expect to find their favorite products throughout the store including freshest produce, scratch bakery, designer floral and in-store butcher. Lee’s plans to add more organic produce and specialty foods throughout the store as well. The pharmacy will continue to care for existing and new patients without disruption. As part of Lee’s commitment to a smooth change, the store will remain open during the transition.

Lee’s Marketplace currently has three stores in Logan, Smithfield and North Ogden, with a fourth store under construction in North Salt Lake that is expected to open later this fall. Lee’s Marketplace is committed to serving their communities through quality products, friendly service, clean and bright stores and multiple community partnerships.

For more information about Lee’s MarketPlace, visit their website http://leesmarketplace.com/

About Lee’s Marketplace
Lee’s Marketplace opened in 1981 when Lee and Shari Badger purchased Jack’s Foodtown in Smithfield, Utah. The family-owned grocer specializes in clean, bright and friendly stores while offering shoppers a designer floral department, chef-inspired deli, scratch-bakery, full-service butcher and friendly pharmacy. Lee’s focuses on providing shoppers with a hometown feel while staying involved in the communities they serve. They currently have three locations in Smithfield, Logan and North Ogden, Utah.

Media Contact:
Rachael Wabel
rmwabel@afstores.com
801-978-8913

Source: AFS

###

Hi-Res Listening Station displays expands to more than 250 Magnolia Home Theater locations at Best Buy

Hi-Res Listening Station displays expands to more than 250 Magnolia Home Theater locations at Best Buy


Minneapolis, MN, 2016-Aug-26 — /EPR Retail News/ — High-resolution audio is expanding to more than 250 Magnolia Home Theater locations across the nation beginning this week.

Last year, Hi-Res Listening Station displays – developed with Sony Electronicsdebuted in 82 Magnolia Design Centers at Best Buy, bringing studio-quality music to masses.

High-resolution audio sounds like you’re standing right next to the artist playing the track. Similar to the jump in TV tech from standard definition to high-definition, high-resolution audio lets music fans hear the full recording, including the parts MP3s leave out when they’re compressed for downloading or streaming.

Each Hi-Res Listening Station boasts a wide variety of recordings provided by Sony Music Entertainment, Universal Music Group and Warner Music Group. The new display includes dozens of music clips, in nearly every genre, as well as their jacket art; both of which are updated on a regular basis. It also features both catalog titles and new releases, including a track from Norah Jones’ upcoming album “Day Breaks.”

In addition to a high-resolution Sony Walkman, the new display showcases a number of compatible headphone models including the Sony MDR-1A, the Sennheiser HD558, the Sennheiser Momentum M2, the Polk Hinge, and the V-MODA Crossfade.

Source: Best Buy

###

Vernieuwing Allerhande Box biedt klanten meer keuze

Vernieuwing Allerhande Box biedt klanten meer keuze


Zaandam, 2016-Aug-26 — /EPR Retail News/ — Albert Heijn biedt klanten vanaf vandaag keuze uit twee nieuwe varianten van de Allerhande Box: de Familiebox voor vier personen met gerechten speciaal gericht op gezinnen en de Inspiratiebox, een maaltijdbox met verrassende gerechten en smaakcombinaties voor twee personen. Klanten kunnen nu ook uit vier aangeboden maaltijden de drie kiezen die zij het lekkerst vinden. De gerechten in de Familiebox worden wekelijks getest door kinderen. Met de twee nieuwe boxen biedt Albert Heijn verse maaltijden voor iedere gezinssituatie.

Zelf gerechten kiezen
Het Allerhande foodteam krijgt regelmatig reacties van klanten op de gerechten in de Allerhande Box. Klanten geven aan het prettig te vinden wat extra keuze te hebben bij het samenstellen van de maaltijdbox. Zo is bijvoorbeeld niet iedereen een liefhebber van vis of vegetarisch eten. Om die keuze te bieden kan er vanaf nu worden gekozen uit vier gerechten. De klant selecteert de drie favoriete gerechten en stelt op die manier zelf de Familie- of Inspiratiebox samen.

Kidsproof gerechten
De Familiebox is speciaal ontwikkeld voor gezinnen met kinderen. De helft van de jonge gezinnen ervaart te weinig vrije tijd en wil daarom zo kort mogelijk in de keuken staan. Verder zien ze graag gerechten in de box die ook goed in de smaak vallen bij kinderen. Daarom vinden klanten in deze box vooral vertrouwde, makkelijke gerechten met mildere smaken die in 20 minuten te bereiden zijn. Alle gerechten worden wekelijks getest door een kinderpanel. Pas na een volmondig ‘ja’ van de kinderen komt het gerecht in de box. De Familiebox wordt vanaf 29 augustus voor het eerst bij klanten thuisbezorgd en biedt in de eerste week bijvoorbeeld een recept van homemade kip kerrie met ananas, rijst, sperzieboontjes en amandelen.

Over de boxen
De Familiebox biedt drie gevarieerde en verse maaltijden voor vier personen en kost €49. De Inspiratiebox biedt nieuwe en verrassende producten, smaken en kooktechnieken, bevat drie gerechten voor twee personen en kost €37,50. Klanten kunnen beide boxen los of samen met alle andere boodschappen op ah.nl bestellen om zonder bezorgkosten op een moment naar keuze thuis laten bezorgen of afhalen bij een Pick Up Point en bij elke AH winkel in Nederland. Benieuwd naar alle gerechten? Kijk voor meer informatie op ah.nl/allerhandebox.

Vertegenwoordigers van de media kunnen contact opnemen met een van de woordvoerders via telefoonnummer: 088-6592020, via e-mail: pers@ah.nl of via twitter @AlbertHeijnPers.

Source: Albert Heijn

###